20-Minute Tableau Viz: Legal Medical Marijuana

Data

20-Minute Tableau Viz: Legal Medical Marijuana

//

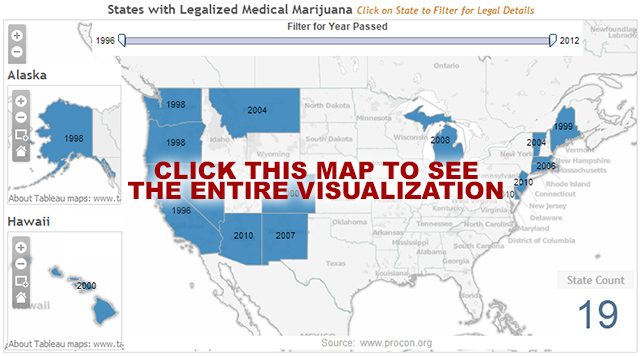
I saw an interesting post and data set this morning from ProCon.org. The information was in tabular form, so I copied it and extracted the data into Tableau. 20 minutes later, I had a fully-interactive dashboard that presented the information relevant to me in a map.  The map displays the year medical marijuana was legalized in each state. The filter allows you to see which states were early or late adopters. The dashboard includes three maps, one crosstab and one URL object. The URL action allows you to display the relevant legal details from the ProCon.org website.

Click the Map to See the Entire Visualization
Map Visualization

More About the Author

Dan Murray

Director of Strategic Innovations
Ten Questions for ChatGPT about Tableau and Level of Detail Expressions I had some fun with ChatGPT asking it questions about cohort analysis this week. I’ll spare you the 4,000 words it created on general ...
The BI Cantos: Facilitating Data Culture Environments that encourage learning, sharing and discovery will prosper. Environments that don’t will not achieve high ...

See more from this author →

InterWorks uses cookies to allow us to better understand how the site is used. By continuing to use this site, you consent to this policy. Review Policy OK

×

Interworks GmbH
Ratinger Straße 9
40213 Düsseldorf
Germany
Geschäftsführer: Mel Stephenson

Kontaktaufnahme: markus@interworks.eu
Telefon: +49 (0)211 5408 5301

Amtsgericht Düsseldorf HRB 79752
UstldNr: DE 313 353 072

×

Love our blog? You should see our emails. Sign up for our newsletter!