One of the dangers of getting older, enjoying technology or writing a book is becoming sedentary. In December of last year, I realized that my lifestyle was simply not healthy. I wasn’t eating properly or exercising enough. My weight was 182 pounds (well over my ideal of 155). I decided to use the time I spent off the road, writing a book, to develop some new habits.
Using Fitbit to Track Activity
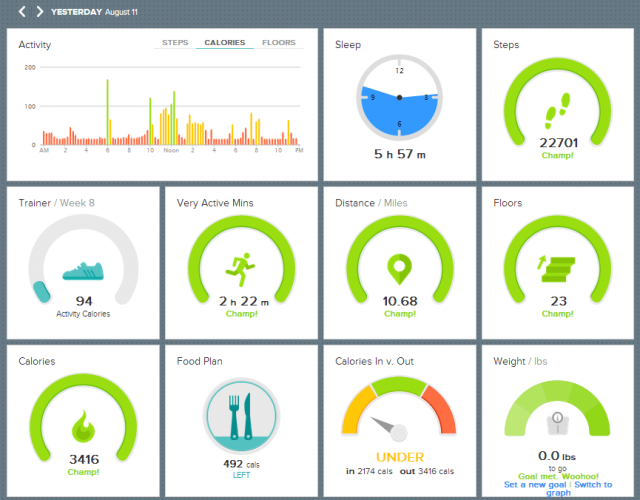
I love data and technology, and the Quantified Self movement is fascinating to me, so I decided to “quantify myself” using the Fitbit device to track my activity (calorie burn, steps, distance and sleep hours). I also wanted to document my eating habits and track my calorie intake. After searching, MyFitnessPal seemed to offer a convenient way to capture what I was eating.
Resisting the urge to set aggressive activity goals, I decided to start by doing a moderate combination of 40 minutes of aerobic exercise, walking 2 miles per day and climbing 20 flights of stairs. This sounds like a lot, but the majority of the physical activity was very moderate.
Losing weight and keeping it off is a lifestyle choice. I decided to eat 500 fewer calories per day than I burned–for me that meant between 1,800 and 2,000 calories per day. My diet consisted of the following changes:
- Give up hamburgers
- No french fries
- Limit pizza intake to 4 slices each week
- Eat more salad
- Eat more broccoli
I started exercising in late January after walking for a few weeks. Then in February I implemented the dietary changes. When my new Fitbit arrived, I started logging everything.
What’s nice about using Fitbit and MyfitnessPal is that the applications work together. I opted to purchase an annual membership from Fitbit. Premium members can download the activity captured by the device as well as the calories consumption data from the MyFitnessPal service.
Tracking calorie burn and intake was motivating. I “gasified” the whole process. Within a week, the daily 5:45 a.m. trips to the local YMCA became a habit.
As the weeks went on, the intensity of my workouts increased while my ability to recover from more intense sessions improved dramatically. I still do 40-minute workouts Monday through Friday, but on the weekends I’ve extended those sessions to 90 minutes–and I enjoy them.
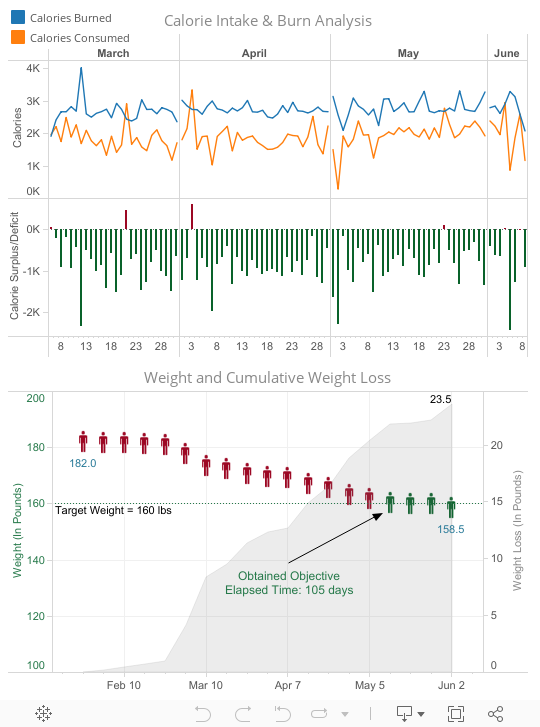
Analyzing Progress In Tableau
Using Tableau to analyze my calorie burn and intake further “gasified” the entire process. I reached my target weight in 105 days, then decided to try for my “fit” college weight of 155 … also attained.
Making progress is motivating. Seeing the progress by measuring my exercise and eating was insightful. My diet wasn’t a challenge to maintain. By starting slowly and building my workout habit over a few weeks, it wasn’t taxing or something painful that I didn’t enjoy.
That’s probably the most important lesson learned. Every little activity adds up to something significant. Start slowly, build gradually and don’t try to institute a Draconian dietary regime.
The Latest
-

Kickstarting Data Innovation in Healthcare
18 April, 2024