
When Tableau released Tableau 8.1, there was a lot of buzz surrounding R integration. Tableau 8.1 has come and gone, and Tableau released another great update with Tableau 8.2. However, I still find a lot of confusion and lack of online resources regarding the actual use of R inside of Tableau. We are spoiled by Tableau because it behaves in a consistent manner when it comes to handling underlying data. As a result, if you have been utilizing R integration, then you may have become frustrated by seemingly inconsistent behavior. To alleviate this confusion, we need to understand how data is handled between Tableau and R.
To drive this example, I found a data set at the UCI machine learning data set repository. It is an invaluable resource for sample data sets regarding specific types of analysis. This data set in particular contains information regarding the acceleration, weight, displacement, horsepower and MPG of several hundred models of vehicles. The goal here is to find a correlation between displacement and MPG.
Creating the Calculated Field
Let’s look at a simple example of correlation between two continuous measures to better understand how R integration works in Tableau. The correlation coefficient is a measure of the relationship between two variables. It is used to determine if the relationship is positive or negative as well as the strength of the relationship. Its value is always between -1 and 1. To obtain the correlation coefficient, we need two lists of numbers: one for average displacement by car and another for average MPG by car. Here, I am creating a calculated field called “Displacement” with the following formula.
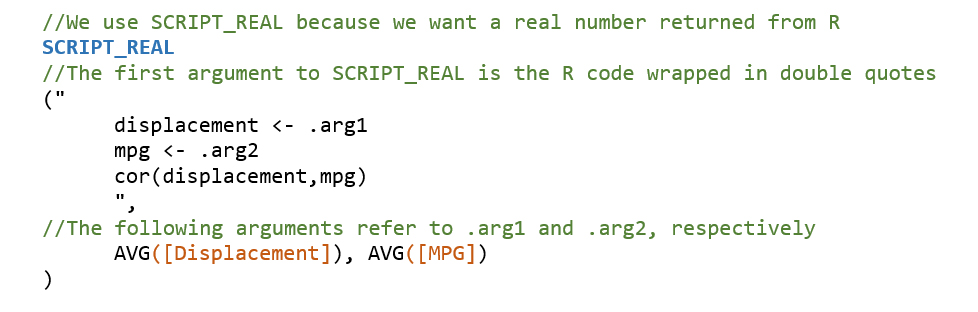
It is important to remember that Tableau will treat any calculated field using the R functions in Tableau (SCRIPT_REAL, SCRIPT_BOOL, etc.) as a table calculation. That means that your calculations will not be performed on the underlying data. Tableau will assign each .arg# as an R vector according to the scope and direction of your table calculation.
Scope and Direction Changes
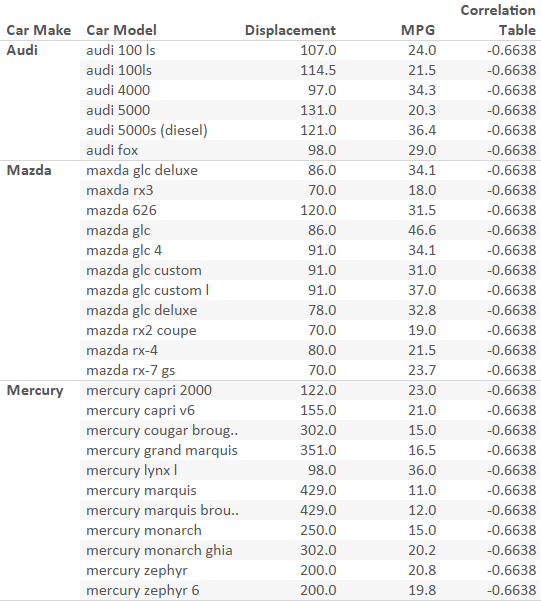
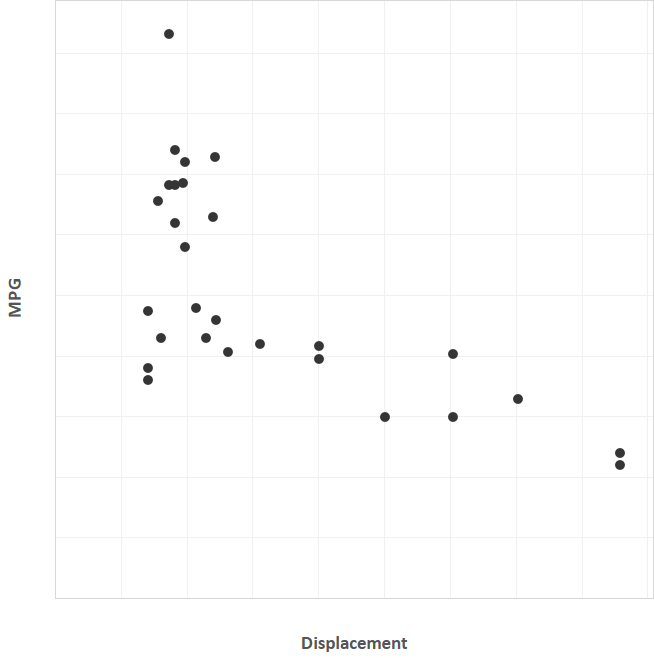
For example, the picture above shows a crosstab displaying the correlation between acceleration and MPG. In the view window, we have several models of cars. Each pane is a car make. In this example, we have the correlation table calculation set to Table (Down). With this scope, we will calculate the correlation across all car makes. Below is a scatter plot of each car by its average displacement and MPG. Notice the negative and somewhat strong correlation that corresponds with the value -.6638.
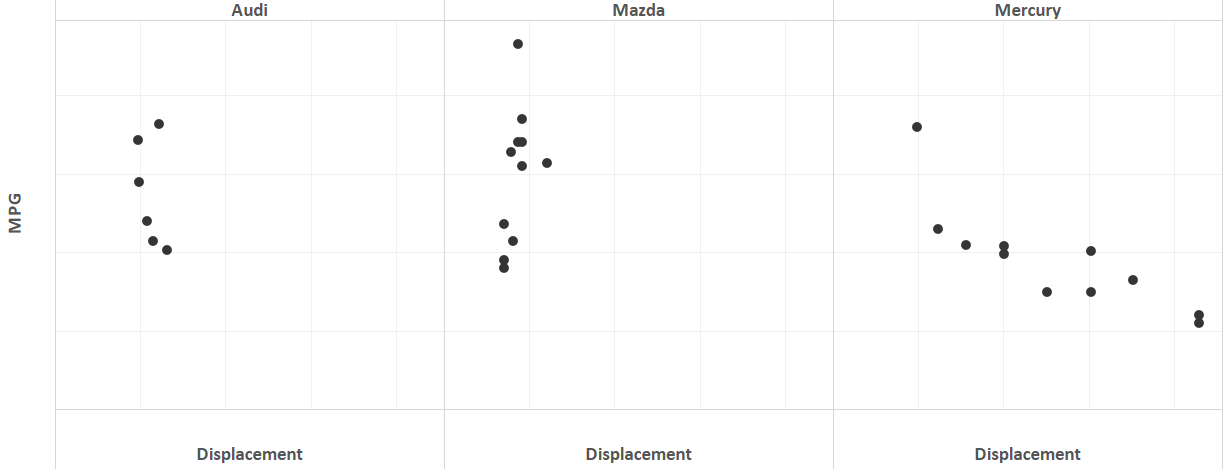
Now, let’s look at the same crosstab, except correlation is now calculated Pane (Down). Notice below that each of the car makes have a different correlation. By changing the scope of the calculation, we have separately calculated the correlation for each model of car in the window.
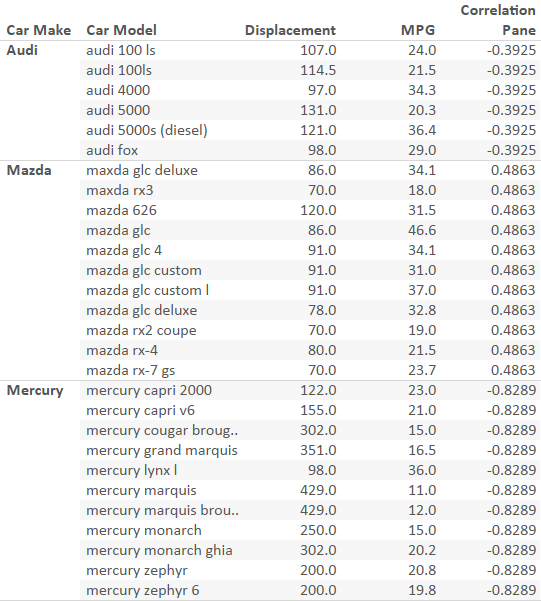
Just as before, we can look at the scatter plot. This time, it will be separated by car make. Notice the strong negative correlation for Mercury that corresponds with a value of -.8289. Notice also the weak (and unexpected) positive correlation between displacement and MPG for Mazda models.
R integration is a powerful addition to Tableau in 8.1, but errors stemming from incorrect R code and issues with table calculations will stymie even the most seasoned Tableau user. I suggest testing all code in RStudio before transferring it into a calculated field. If the results don’t appear as you expected, remember to check the scope and direction of your table calculation. For even more flexibility, utilize parameters to calculate correlations for multiple measures on the fly!