For those of us who cannot live without both the internet and NFL football, Sunday afternoons no longer involve staring at just one screen. The television is dedicated to the game, my phone is dedicated to fantasy football and my laptop is for Reddit game threads on r/nfl.
Reddit has a thriving football community that is an interesting mix of tech-savvy individuals and football enthusiasts, a relatively recent demographic. Each Sunday, we all gather around our computers while watching our teams to chat about great plays, bad calls, tired commercials and general gossip about the comings and goings of the NFL. But the Sunday night before last was special. Peyton Manning broke Brett Favre’s record for career touchdown passes. Let’s see how Reddit reacted in a Tableau viz that I created.
How It’s Made
Using the Reddit API, I was able to pull post data from the three Sunday night games for Week 7. Primetime games usually have the highest post volume because:
- They are the only game on television at the time.
- The networks attempt to select the most intriguing matchups for these time slots.
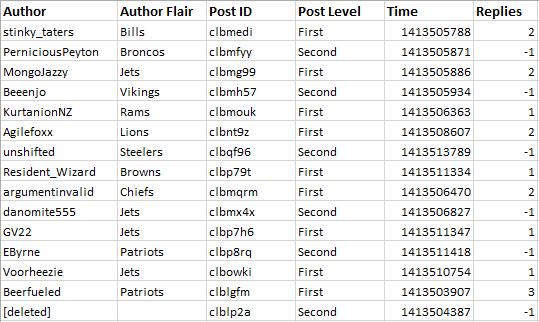
This game in particular had a lot of viewers due to the added significance of the record. To reduce data volume, I only pulled posts that were first or second-tier. A sample of the data can be seen below:

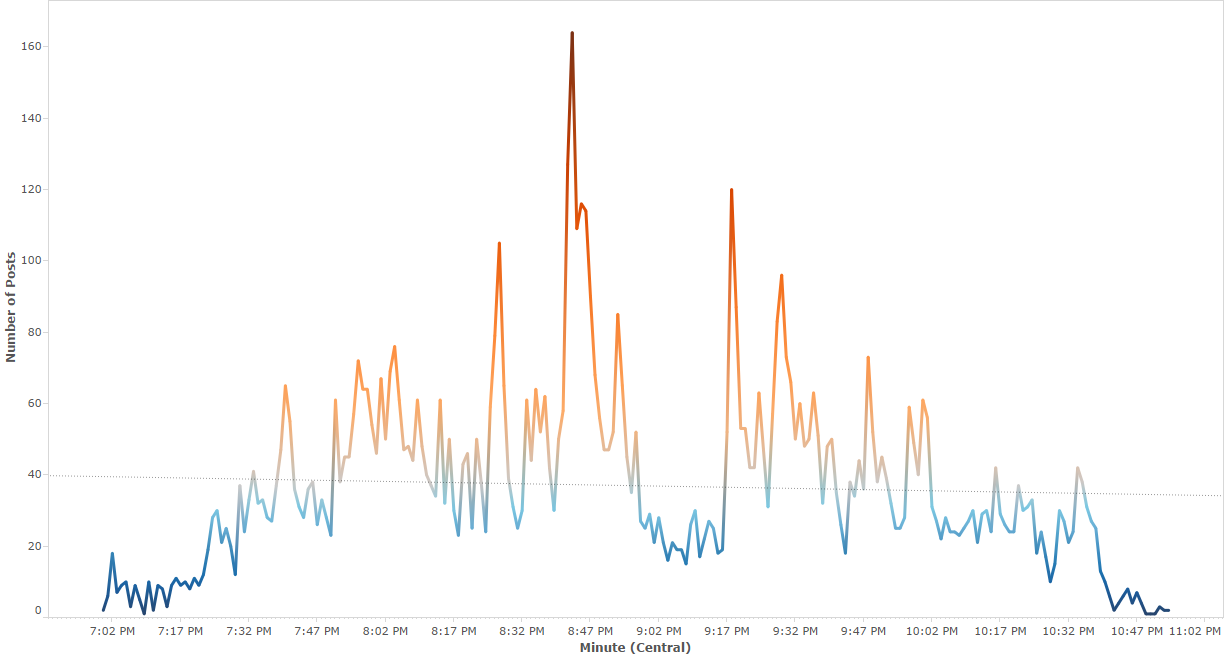
Using Python, I pulled the first and second-tier comments from the Reddit game thread for the Thursday night game between the Jets and Patriots. After connecting to this data in Tableau and calculating the date as above, I created a line chart by time and volume of posts. You can clearly see the sharp peaks in posting volume below:

As expected, there is a lot of random variation. There are, however, some very clear peaks that indicate a surge of posts. I suspect that these coincide with events in the game.
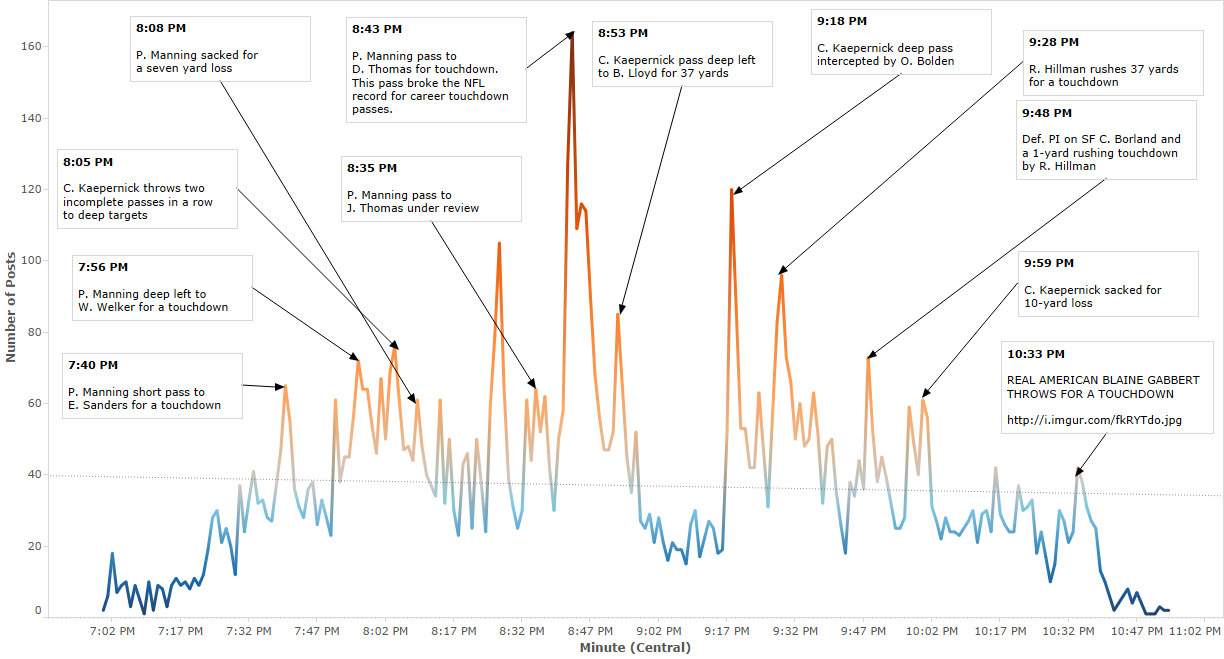
Most play-by-play services provide game-time occurrence of plays, but that isn’t helpful given that I need the actual time a play occurred. Fortunately, there are automated twitter handles that post play-by-play information for each game. Using the Twitter timestamp, we can get the actual time of a play in the game and add annotations in Tableau to each of the peaks. The information for the annotations came from the Twitter handle, @broncos_pbp.

As you probably already suspected, the huge peak in posting volume at 8:43 PM Central Time corresponds to Peyton Manning breaking the record. The small peak immediately after is the game of “keep away” played by his receivers in celebration. The posting reaches a lull around halftime and then spikes again shortly after Colin Kaepernick throws a deep interception. It makes sense that touchdowns, interceptions and sacks would cause a spike in activity, but it is also interesting to see the peaks caused by discussion during official reviews and consecutive incompletions at 8:05 PM and 8:35 PM, respectively.
Check Back for More
Reddit’s r/nfl crew was out in full force to watch this game. It’s great to be able to read the story of the game in such a simple visualization. In the coming months, I plan to revisit this data by analyzing the content of the posts and updating this visualization each week for the primetime games on Thursday, Sunday and Monday.
You can check back here on Wednesday of each week to see the new charts for the most recent primetime games.


