
Donut* charts offer a quick, high-level view of data dimensions that have few members, and together, contribute to a whole. Essentially, it’s a pie chart with a hole. It’s not glamorous, but it’s quick and informative. The extra level introduced by the donut hole allows for a top-level aggregation of the members of the underlying pie chart.
Used in Tableau, these charts are more than interesting to look at. They can be leveraged easily for dashboard filtering and menu navigation. There are plenty of great uses for this simple and elegant visualization.
*Preferred spelling, as it looks more delicious.
Good uses of this type of chart
- Quick high-level view of percentages/shares of total.
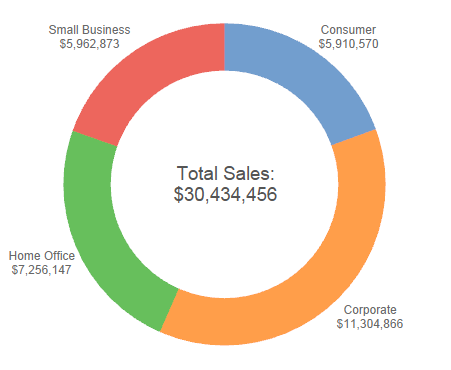
- Your dimensions are few: In this example, we are only looking at four members of a partition. However, no slivers are so small that they are hard to see/click.
- Values are large enough to be read at all.
Good uses of this type of chart in Tableau
- Dashboard filter/highlight action: Instead of a quick filter, use a pie or donut to filter your dashboard. You’ll get a prettier filter and better performance than a quick filter.
Times to avoid this type of chart
- One or more of the partition members is small, making it difficult to see at all.
- Avoid a pie or donut when you want to visually compare actual values or trending from member to member. In that case, tend toward bars or line charts.
Download the attached Tableau 8.1 workbook below, which includes step-by-step instructions for creating a donut chart using the Superstore dataset.