
The Tableau Performance Checklist series is designed to help you streamline your dashboard performance and Tableau Server configuration. Each post expands upon one item listed in the master Tableau Performance Checklist. As of 2024, you can find an updated Tableau Dashboard Performance Checklist here.
Here’s the second item under Local Computations:
“Table calculations are powerful, but they can be slow. They are dependent on the local computation engine and can require substantial memory.”
Let’s get started.
Table Calculations
Table calculations are computations that use the values in the entire table and can restructure them for different views and fields. There are two types of fields when it comes to table calculations: partitioning and addressing. Partitioning fields group your data into different buckets. Examples include segmenting sales data by region, product category or by employee. Each of these partitions is then acted upon by the calculations.
Addressing fields determine the direction that your calculation will take. A common addressing field would be date. Using any of the examples above, we could group sales by date or category or employee (partition fields) and then display them in a year-after-year (addressing field), stacked bar chart.
Table calculations are often used to create a common baseline for events that start on different dates, weighted averages, percent of total and more. My colleague Thomas McCullough actually has a great blog post on some essential table calculations that every Tableau user should be familiar with.
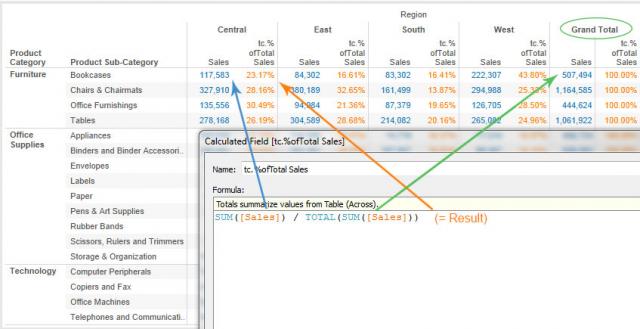
Above: A Percent of Total table calc broken down.
Use with Caution
The potential problem with table calculations is that they use the local computation engine. Tableau’s Data Engine is a breakthrough in powering the ad hoc analysis and drag-and-drop features of Tableau Desktop. It is quite powerful, but visualizations that rely quite heavily on table calculations to tell their story can create a performance lag. The more complex the dashboard and the underlying data, the more opportunity for you to improve your visualizations’ performance.
The best thing you can do is to alleviate the workload in Tableau Desktop by preparing the data as much as you can before it is used in the table. This is a common theme throughout the Tableau Performance Checklist. As a data analytics tool, Tableau gives you an incredible amount of power and flexibility in what you create. The big caveat is that if you’re using a substantial amount of data with thousands of users, you’re going to slow down Tableau Server.
You CAN do it, but there are better ways to optimize for performance. And the best way is to do the extra work in your database so that the data is prepared and ready before it hits Tableau Desktop.
Mastering Best Practices
If you’re interested in becoming a Tableau Server guru, then learning these performance best practices is essential. Check back frequently as we add new posts and dive deeper into each point in the Tableau Performance Checklist.
Another great way to identify best practices is to leverage the insights offered by our Performance Analyzer, part of Workbook Tools for Tableau. It will examine all of your workbooks, worksheets, dashboards and data sources against a list of best practices to ensure that you’re using all the tips and tricks to guarantee your visualizations are moving at light speed.
As always, feel free to get in touch with us if you have any questions regarding performance or anything Tableau related! We’d be happy to help.