Tableau comes preloaded with a great set of shapes already available for the user to choose from. Shapes are useful in scatterplots and in bulletgraphs, among other visualizations, so having a variety to choose from is necessary to create as dynamic a visualization as possible. However, Tableau can’t anticipate every situation in which it would visualize data, so you may want to use shapes outside of its preloaded sets.
In order to do this, I’ll be using some image manipulation software, supplemental to Tableau. I’m a big fan of Paint.NET, but there are other alternatives, such as the ubiquitous Adobe Photoshop and GIMP. You can download Paint.NET free here.
To start, you’ll obviously need some pictures. Get your pictures by the method of your choosing: the fewer the colors, the better. Ideally, black and white pictures will make the most dynamic shapes because they can reflect color changes. Having that extra dimension by which to sort with is quite useful. I recently did a politically themed visualization with Tableau, so I found the elephant and donkey typically used to represent the Republican and Democratic parties, respectively. Here are those images in their original form, found off of a quick Google Images search.


Now, in order take full advantage of the aforementioned color feature, Tableau requires that the background on the image be transparent. If the background is white or any color really, Tableau will adjust that to reflect any color changes made. So, if you add a dimension to sort by color, you will end up coloring the whole picture, and your symbols will resemble colored squares/rectangles. In addition to transparency, you also need to be aware of size. Tableau likes for its shapes to be about 32×32, so try to fit that dimension as best as possible.
To make the image Tableau-ready, follow these quick steps:
1) Open the image in Paint.NET.
2) Select the magic wand tool.
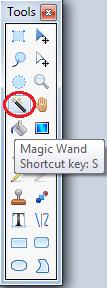
Click somewhere on the background of your image. You may have to click in multiple places to get everything represented. In this instance, I had to ctrl+click on the outside portion as well as on the star on the inside.

3) Hit delete, and your background will go checkered, implying a transparent background.
![]()
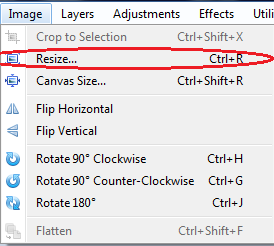
4) With transparency out of the way, now we have to resize the image. I assume that it’ll already be too large, so to downsize, go to Image->Resize… Alternatively, you could press Ctrl+R.
You’ll see this menu after you bring up the resize menu.
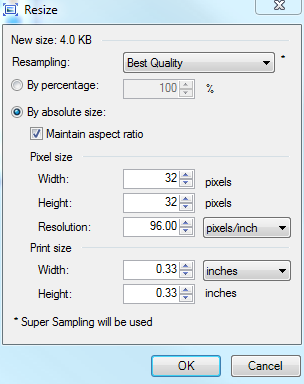
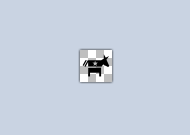
Note that the “Maintain Aspect Ratio” box is checked by default; keep it this way to keep your image fidelity intact. Change either the width or height to 32; the other measure will adjust by default. Experiment to see which one you like better before finalizing. Doing so in my case results in this image:
Save that up because you are done. Repeat the above process for any other images you’d like to include in a custom shape set. In order for Tableau to recognize and actually use these, it must be saved in the repository, which is typically found in your Documents folder. Ultimately, you’ll want to go to Documents -> My Tableau Repository -> Shapes. In the shapes directory lie the included shape sets which Tableau uses automatically. Create a new directory here and place those images in that directory. I call mine “My Custom Shapes.”
When you have added a dimension in the Shapes field, Tableau will automatically assign a shape to each member of the dimension. Click the drop down menu.
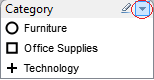
and select “Edit Shape…” to see this window.
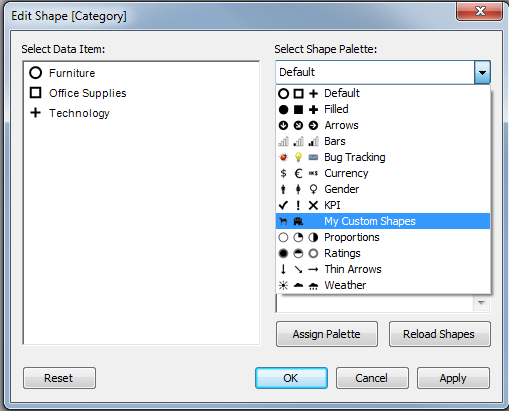
You’ll need to hit the “Reload Shapes” button, then select from the “Select Shape Palette:” drop down list as the above picture illustrates. You’ll see “My Custom Shapes” in the drop down, corresponding to the folder I created earlier. Clicking on those will show you your shapes, ready for use. Manually assign to the data items or just hit the assign palette and your shapes are ready for use. Here is an example using the symbols I imported:
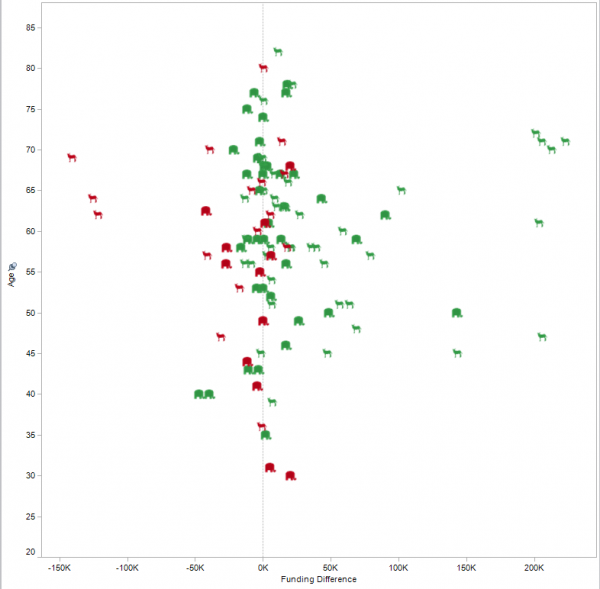
Adding already well- associated symbols to visualize information aids the view tremendously, reinforcing Tableau as the best and most versatile tool for data visualization.
The Latest
-

PYD129 – Tableau Conference History with Dan Murray
23 April, 2024