As purveyors of analytics, we often come against the buttresses of change aversion. Nowhere is this more prevalent than in the lack of acceptance of Tableau tooltips. How often do you present your end users with a powerful and dynamic viz only to be met with, “But where is the legend?” This can be a disheartening conversation to have. Tooltips, however, can add dimensionality to your viz, free up space for content and allow you to convey your data story in the most pragmatic and impactful way possible.
A Tooltip Use Case
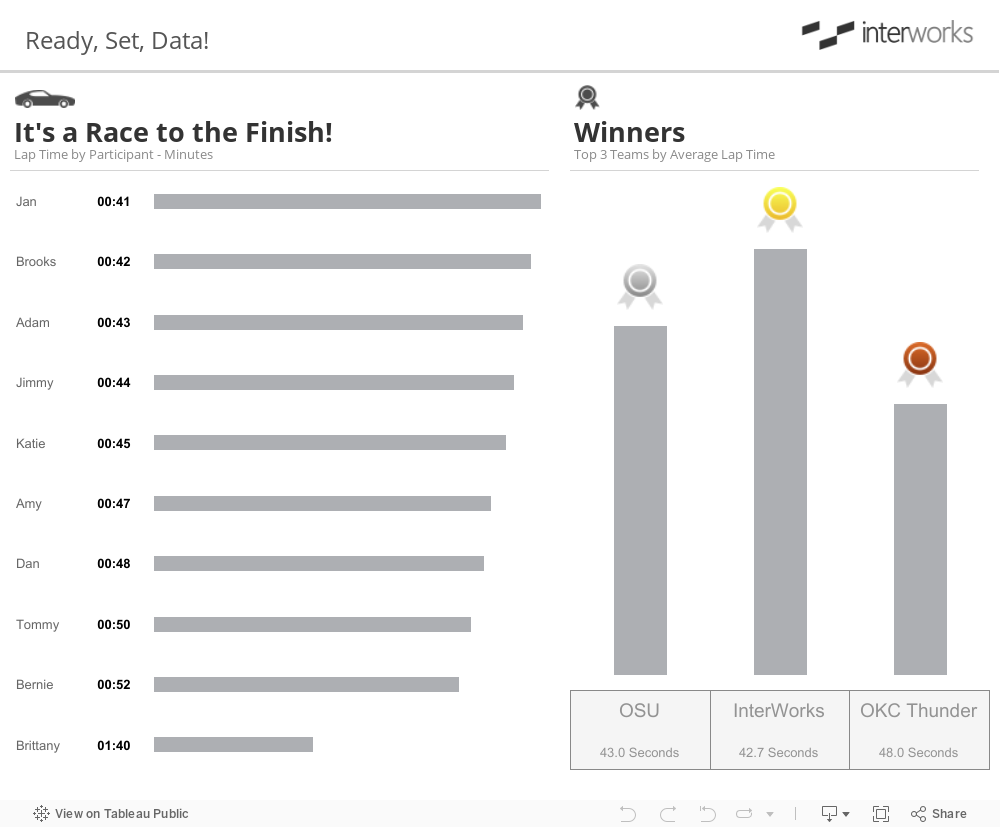
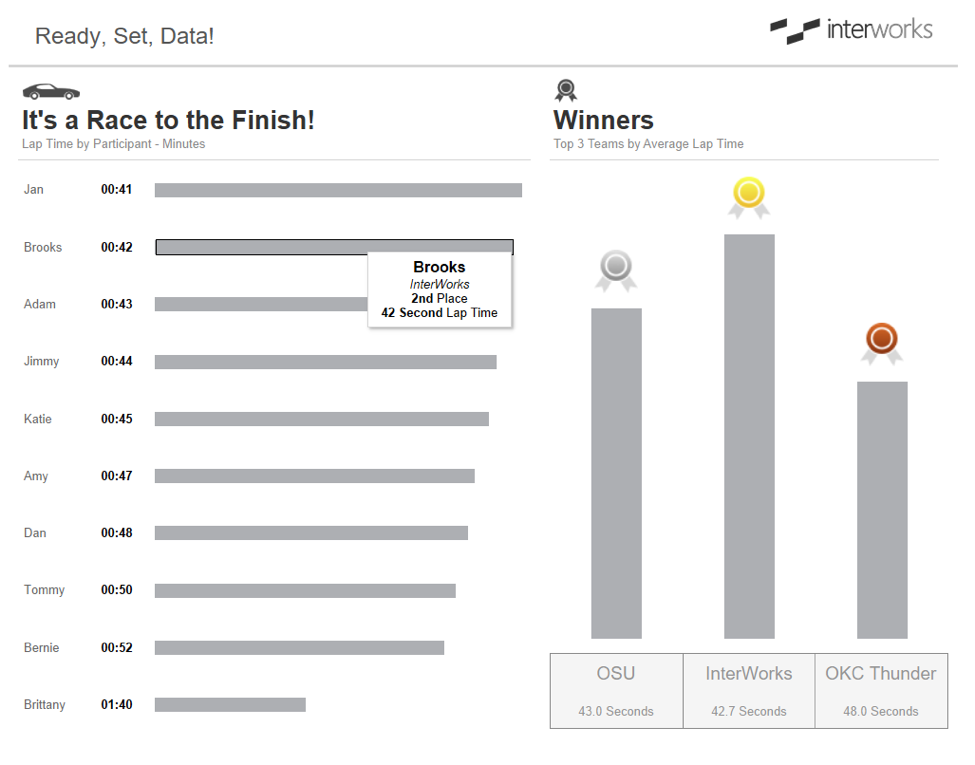
Let’s start by looking at a viz InterWorks recently used to display results from a VR racing module at our InnoTech booth. As you can see below, we deployed a tooltip for the race’s standings with further detail on each user’s traits and results. Within the tooltip, we are able to tell a more detailed story about that user and the data point without having to fill the page with ancillary artifacts.
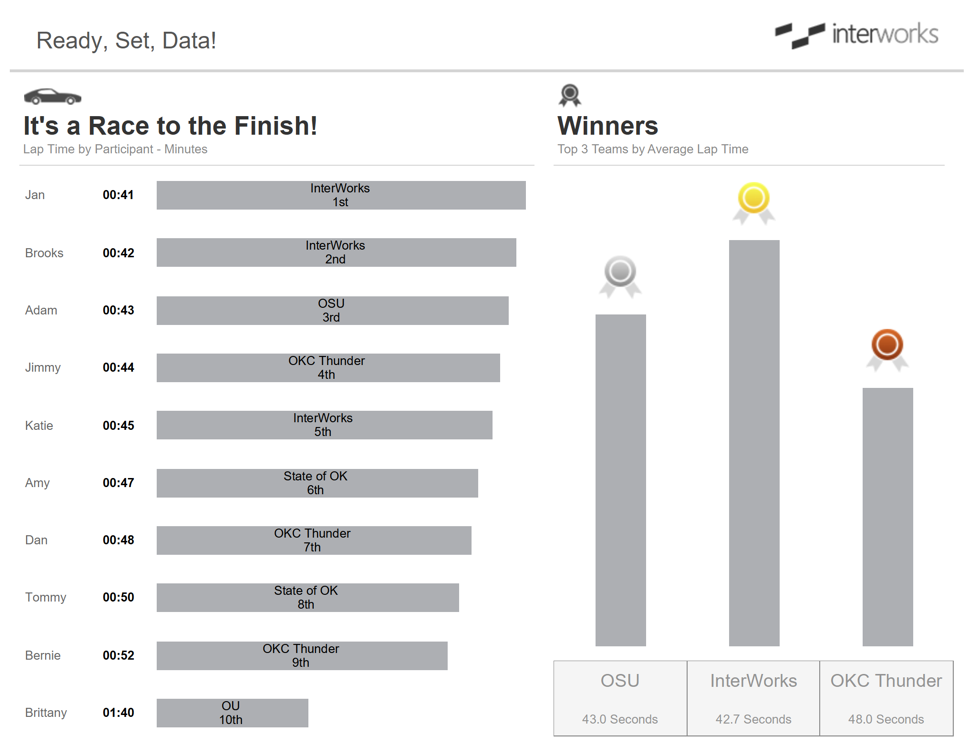
By comparison, if we simply pull that detail contained within the tooltip into the viz, we’ve started to clutter the graphs. Also, our user’s eye is drawn to the information contained within each bar and away from the story we are trying to convey. Imagine if we had further detail within tooltip that would begin to spill outside the borders of each bar. What a mess!
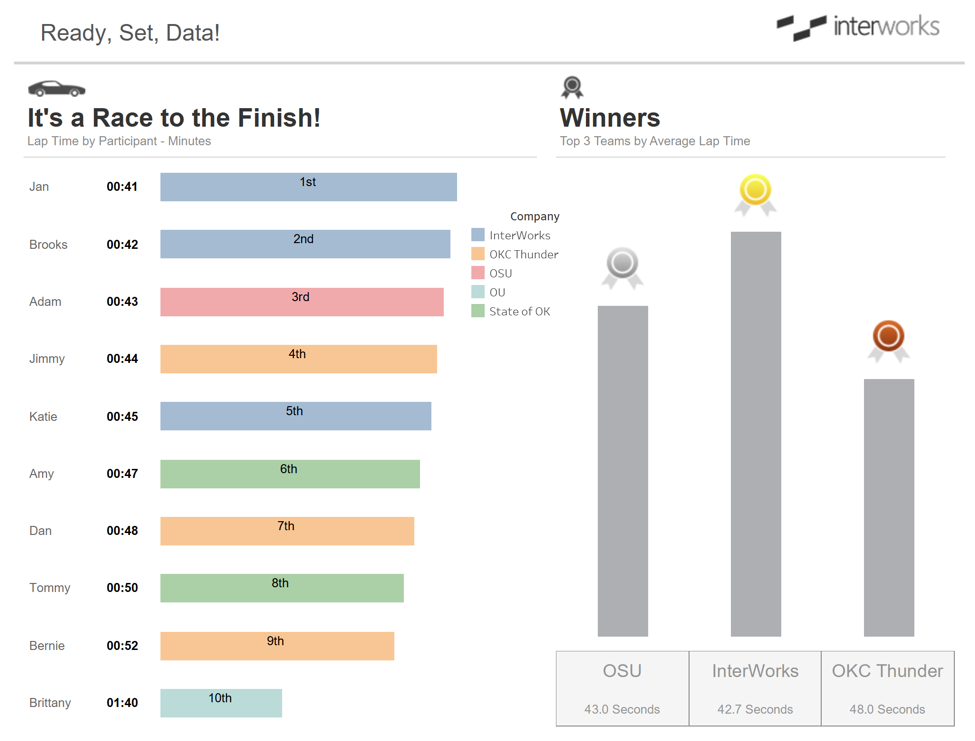
We could also try to add context to each bar within each tooltip by adding color. Below, you can see we’ve created a legend for color assignment by Company so that the end user can visually identify which organization each participant represented.
Although this may speed up a viewer’s recognition, we’ve had to lose real estate for the inclusion of the legend, we’ve disrupted the overall flow of the viz and sacrificed formatting cohesion with the introduction of color. Imagine if this list was 20 bars long with 15 companies represented? The issue would only compound itself as your data becomes more and more complex.
Tooltip Alternatives
Let me wrap up by saying that tooltips are not a saving grace. You may often make a better case for other forms of context (color, shape, etc.) rather than displaying details in your tooltips. In many cases, you may even use a combination of the two. In illustrating the case above, it is important to convey the power of tooltips to your customers and have a compelling argument for their deployment over more conventional details. Explore the full InnoTech viz below to see these tooltips in action.