
In the initial keynote of TC16, Tableau brought the heat. Laying out a grand vision for the next two to three years, Tableau announced many big new features, experiences and even a brand new product code-named “Project MAESTRO.” There’s was definitely something for everyone, from the single analyst making a difference with data to the enterprise organization looking to provide better governance for their users. It was certainly an eventful keynote, and there’s lots to cover. To keep it simple, let’s look at some of the biggest announcements and see what they mean for you and your Tableau deployment.
More Analytics
The ease and beauty of doing visual analytics is the heart of what makes users love Tableau. They look to continue that trend with several features that help users do more. First up, they showed a group of features they dubbed “Instant Analytics.” This included a new way to interact with your visualizations through features like a hover line that allows summaries of several points at once at once or even ranges of dates, all resized or moved through intuitive drag-and-drop action.
Summaries was a key theme seen through many announced features, with Tableau doing more automatic analysis to help highlight key things in the data. These summaries showed up in tooltips, on clusters and within the data window, all providing faster and deeper insight, as well as providing new opportunities for interacting with your data.
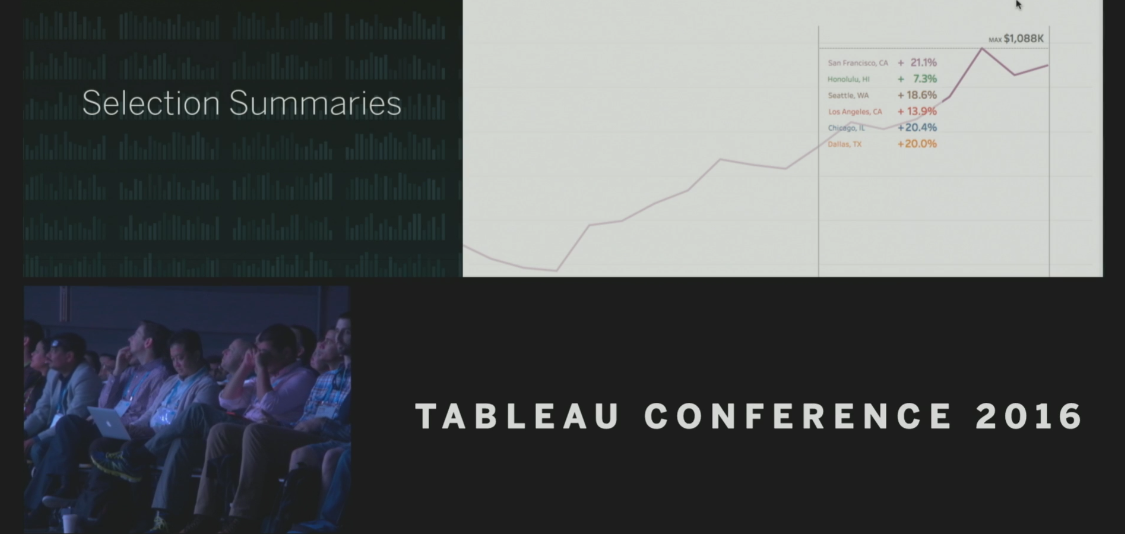
Above: Selection Summaries add a whole new window of insight while working in your data.
Another feature that will excite many analysts are the improved geospatial and time abilities. Tableau has always made it easy to work with time dimensions or geodata, but there were limits when working with multiple data sources that required outside tools. I’m most excited about the new geospatial abilities. First, they showed the ability to connect your latitude and longitude data to the information already known by Tableau or that you’ve brought in, this includes zip code, state and country level information as well as custom shapes. This will allow analysts to quickly group individual points without having to do further work on the data set.
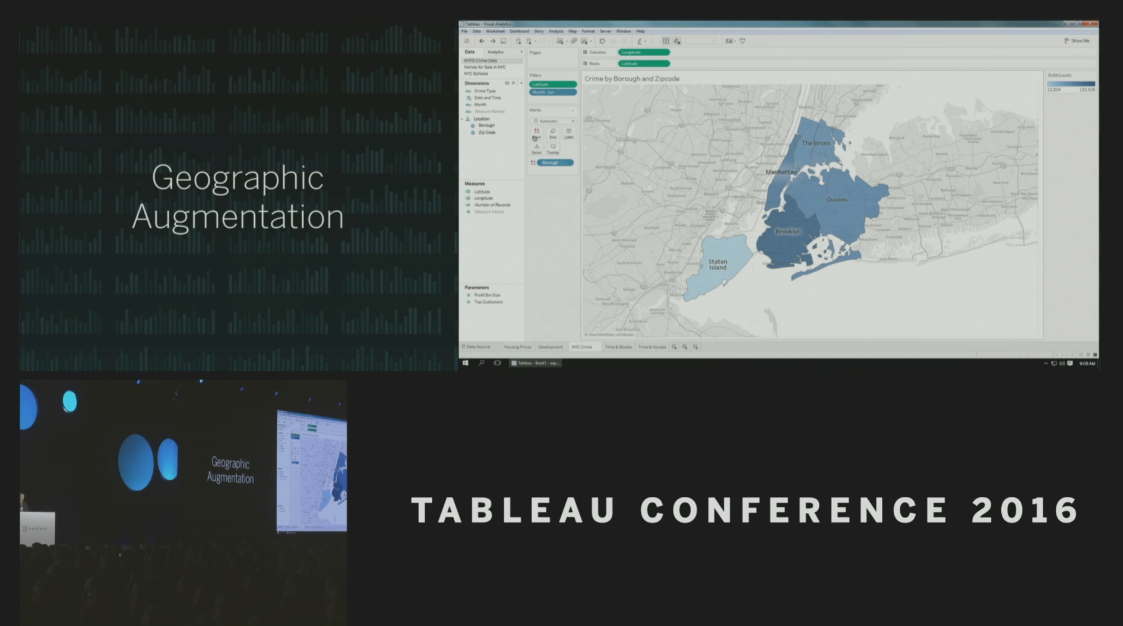
Above: Using Geographic Augmentation to analyze custom territories.
Another area that has always been a pain point is working with multiple data sets on a single map. Tableau will now allow you to add multiple layers of information on a single map coming from a variety of sources. On the time-series front, there will be enhanced abilities to work with dates, such as new one-click alignment of timespans.
Finally, in a demo that likely showed where they are headed in the next two to three years, Tableau showed off their take on Natural Language Support. The interface was able to take a sentence like “show me houses near Ballard” and correctly filter the data to houses that were near Ballard, WA. Perhaps more useful is that Tableau dynamically added more ways to interact with the dashboard, including a slider to indicate how we defined what “near” Ballard meant.
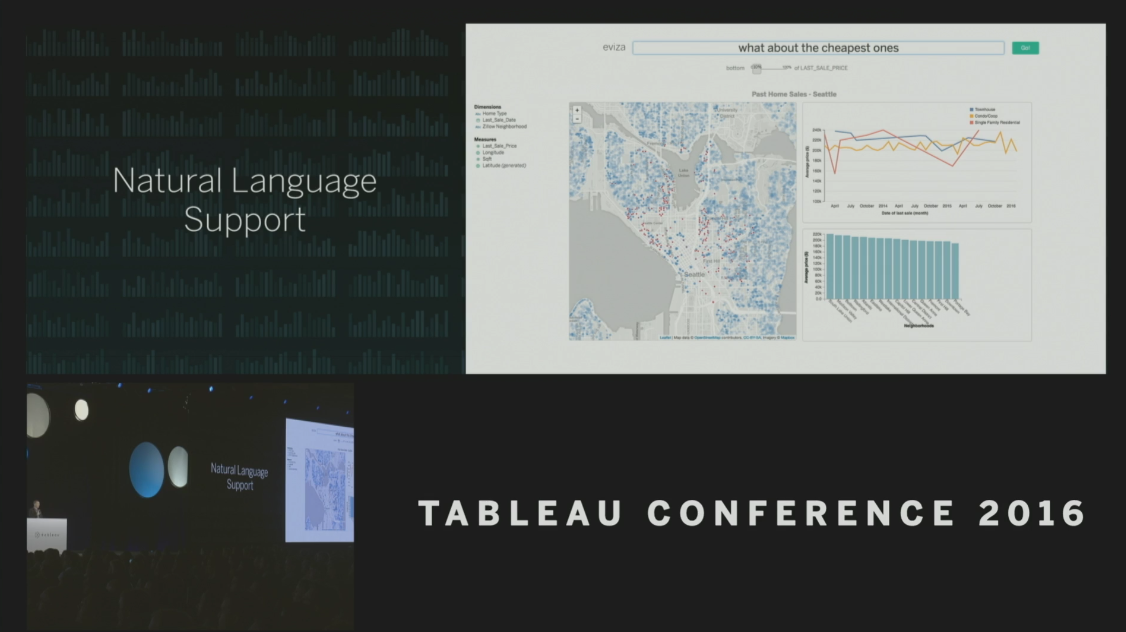
Above: No need to speak database jargon with Natural Language Support.
Alerts and Metrics
Consumers of dashboards within Tableau will have a few new tools to help them get insights faster. Alerting has been a feature third-party vendors have provided for years, but Tableau has announced they will bring a fully integrated version into the tool. From any dashboard, you’ll be able to highlight a metric and set an alert based on different criteria, such as if it reaches a certain constant threshold or if it goes out of a statistical range.
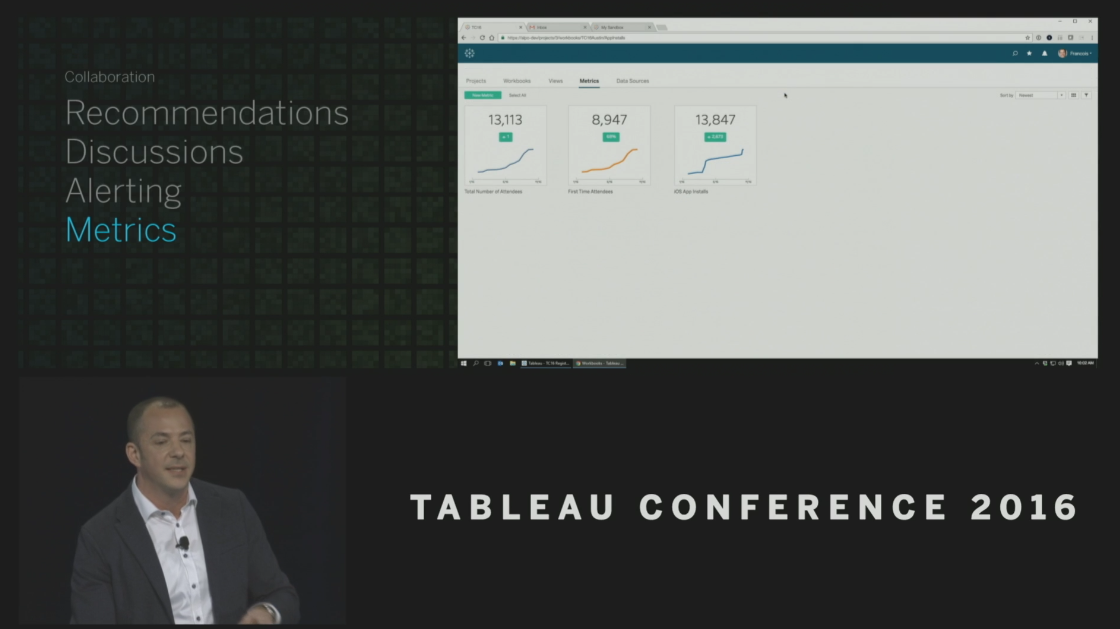
Above: Setting up Metrics is easy!
The Metrics feature aims at making it easier for users to curate their own KPI dashboards with the metrics already created in Tableau. Like Alerting, you’ll be able to go into other dashboards to identify the metrics you want to follow. Tableau will then track that metric and allow you to see a single view with all your metrics and their performance over time. This should make it easier then ever for users to track the information that’s most important to them.
The Arrival of Machine Learning
It’s hard to find a company not investing in Machine Learning these days, but Tableau has brought some very interesting ideas and user-experiences to the table. First off, as expected Tableau is going to do more to help you figure out the workbooks and data you would be interested in. This recommendation engine will be present in the Tableau Server experience, but one big surprise was how it showed up in the analytic experience. As users begin to create visualizations on their data, Tableau will recommend other’s work that might help you or give you additional insight and allow you to bring it into your workspace. Bringing analytics to where people are is going to be a powerful addition, helping people be more efficient and collaborative.
These automated insights made their way into other areas as well, such as the Data window. There, Tableau will start exposing how other users are connecting and using their data so it can recommend to you the best paths forward in your analysis. This will not only make users faster, but it will also help them understand data sets they’ve never touched before.
Collaboration and Data Governance
Collaboration was another key theme seen throughout many of the presenters. There were demos of team discussions happening within the Tableau design interface to help users get answers to their data questions faster then ever. I’m most excited about the introduction of Sandbox environments, which includes both Personal and Team environments.
This has been one of our common recommendations to users for a long time, but Tableau is making it easier then ever to setup and provide an easy promotion path through the environments. This allows individual users to have their own private environment to work on dashboards and then, once it’s ready for sharing or collaboration, they can promote it to their team environment for the group to see. This will provide a much more natural way for teams to work together and help keep Tableau from getting cluttered with everyone’s various workbooks.
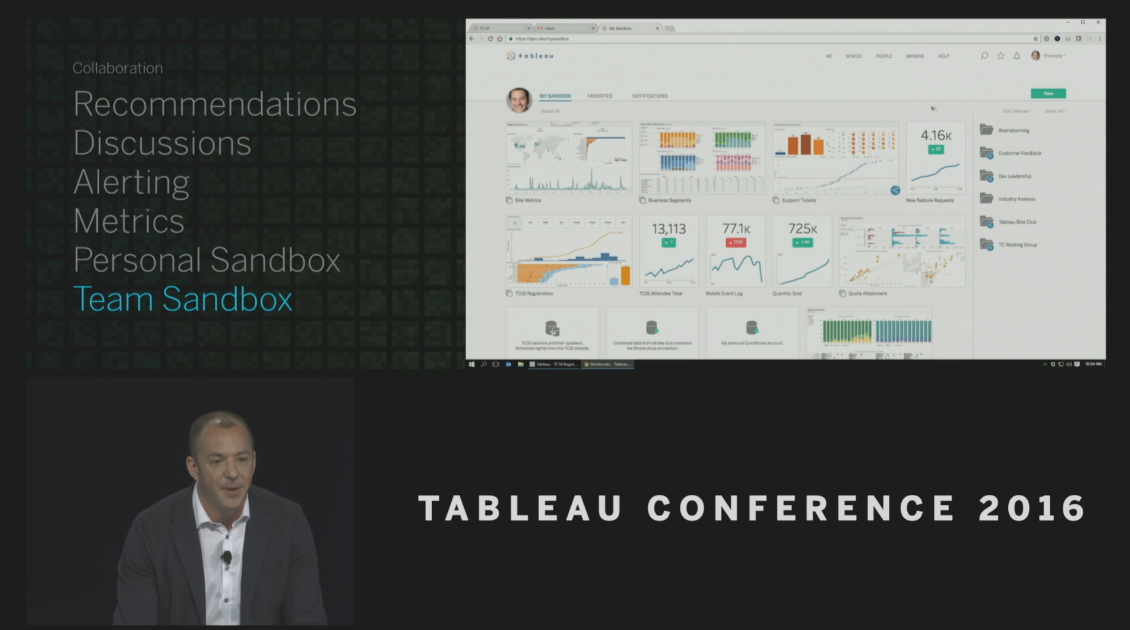
Above: Team Sandbox is the perfect place to experiment and collaborate.
Another exciting addition were the enhanced governance abilities. During the demo, they showed off a new Data Sources screen that gave a user a view of various source they had access to. Their were added stats and information as well as a new badge that indicated if a data source was certified. Certified Content is a feature that allows admins to give their stamp of approval to an entire data set. This, in itself, is a very welcomed addition as it will help users find the data they can trust.
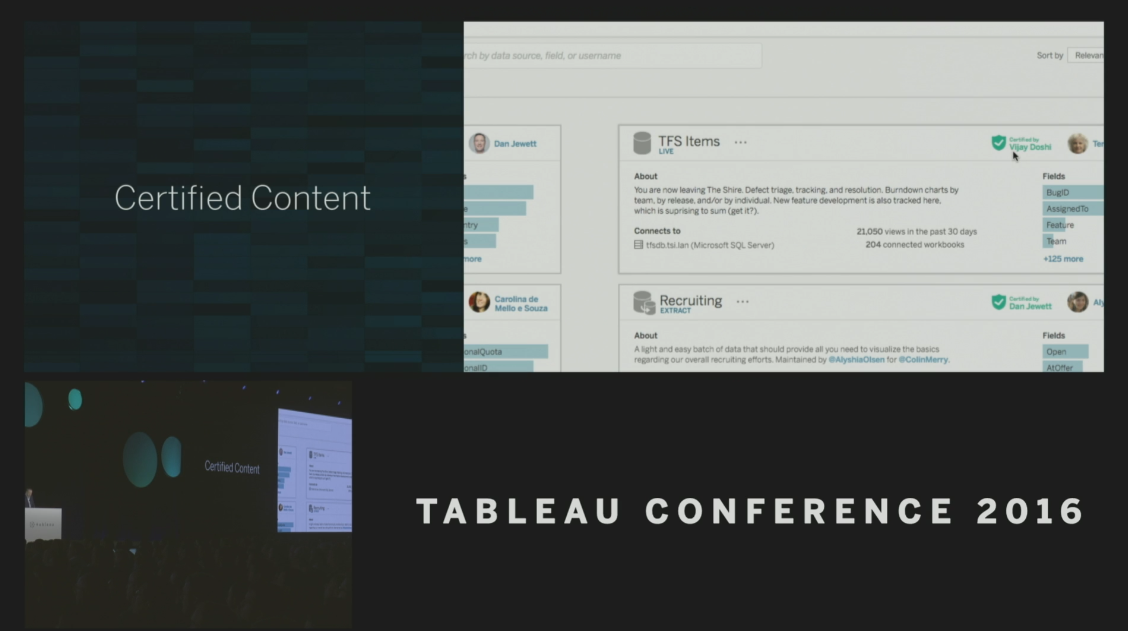
Above: Certified Content helps you designate trusted data sources and more.
Tableau didn’t stop there, however, as individual users can still add additional calculation, groupings and other enhancements to the data, allowing the flexibility that users have come to know and love. These individual additions will not show up as certified, but with a simple click, an analyst can send a calculation for admin review to have it included in the certified version.
The final governance piece they showed off was a fully integrated data audit ability. This will allow admins to see what data sources are being used, when they are being used and, more importantly, how they are being used. Admins will even be able to drill down to see where individual columns within workbooks. Alongside the Certified Content feature, this will give Tableau Server Admins some very powerful tools to ensure they have the best performing and accurate data sets available to their users.
Into the Cloud
Tableau continues their journey to the cloud, supporting all manners of deployments from on-prem and cloud hosted to their SAAS offering Tableau Online. The biggest announcement in this area is that Tableau’s Web Edit is becoming the full-featured Cloud Desktop, which will reach full-feature parity with the Tableau Desktop tool. This will be a huge boon to enterprises trying to get self-service analytics to as many people as possible.
Tableau also announced several connectivity features. First, they are introducing a new Live Query Agent that will enabled secure connections to the servers on your network from the cloud. This should help ease the setup and transition to the cloud for many companies.
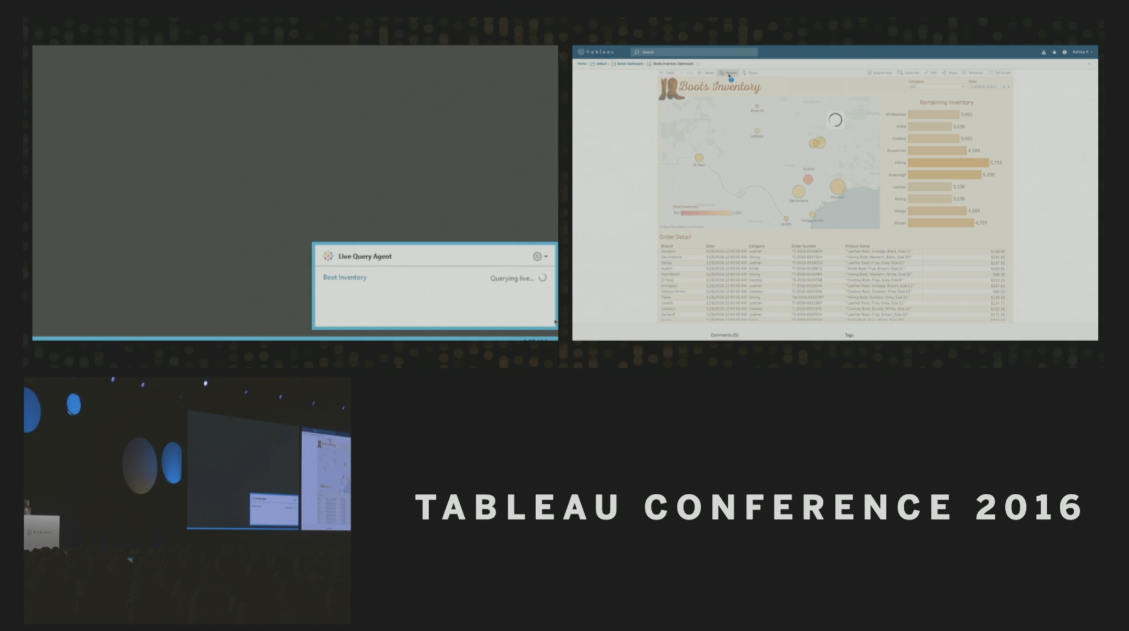
Above: The Live Query Agent in action.
Also making it easier then ever are new pre-built dashboards and connections to common Cloud Applications such as Salesforce. You’ve always been able to easily analyze Salesforce data, but now Tableau has done a bit of the work for you. For new users, this will help build momentum quickly as you introduce Tableau to your installs.
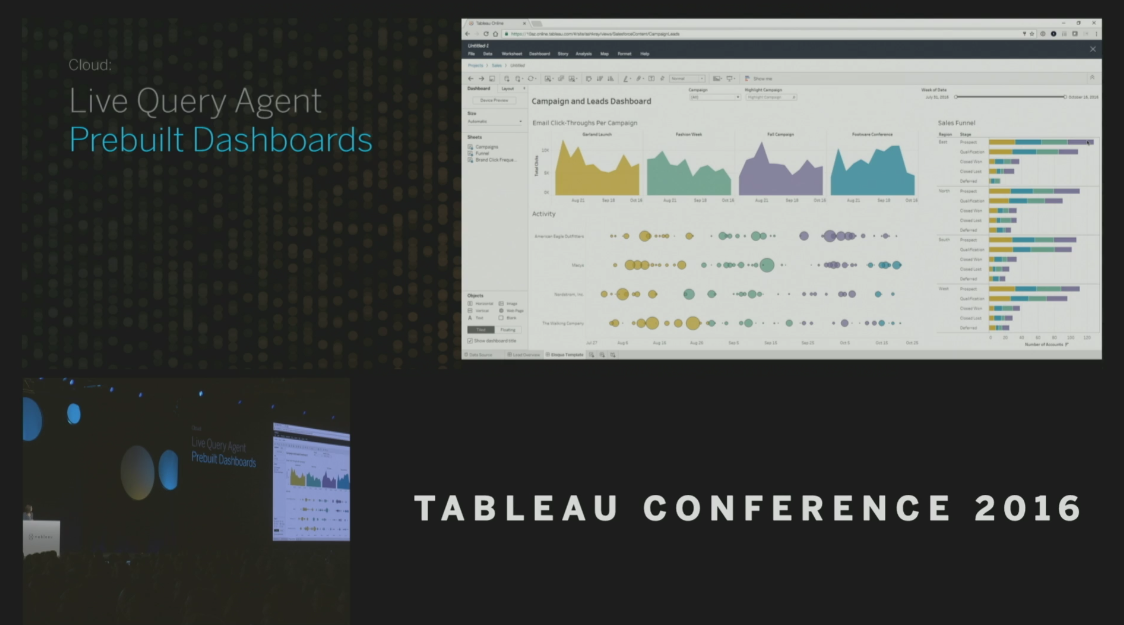
Above: Prebuilt dashboards make Tableau even easier for the non-technical crowd.
The Future of Extracts – Hyper
Since it’s acquisition, Hyper has been a common point of discussion at InterWorks. During the Keynote, Tableau finally pulled the curtain back on the new Hyper Data Engine. This is the next-generation of the Tableau Data Engine and Tableau Extracts allowing for a huge increase in performance and scalability. There are several open questions about Hyper still, but it looks to help enterprises in particular with several problems.
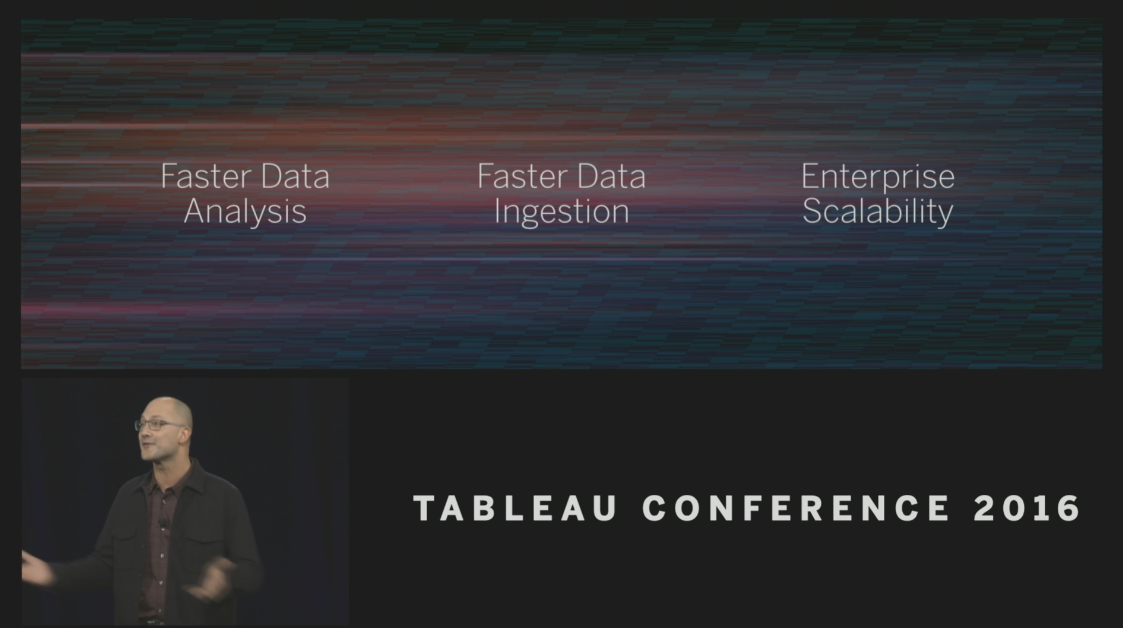
Above: The key goals of Tableau’s new Data Engine – Hyper.
First off, in large Tableau installs, extract management can become a bit complex since they take time to load. Hyper promises to provide real-time data loading, easing the management burden and allow analysts to continue their work on the latest and greatest data. Secondly, Hyper will be exposing more controls to IT to help them manage their environment. Extracts have always been a bit of a black box, but Hyper looks to expose insight and controls for things like concurrency. Hyper also opens the door to better data federation and real-time analytics, and it is the basis of a completely brand-new product offering from Tableau.
Project MAESTRO
Tableau is moving into the data integration and prep industry starting late next year with a brand new product code-named Project MAESTRO. They are bringing the Tableau user experience to a problem that many users experience and a lot of competitors have been attempting to solve. In my view, no one has gotten it right yet. Their take on it involves a very visual view of the data (naturally) but also combines it with a more traditional data flow graph that you see in a lot of traditional ETL tools.

Above: Project MAESTRO allows you to natively and visually prepare your data sources.
In the demo, the combination allowed for you to interact with your different data sets in very natural ways. You connected new data via the flow but could quickly spot bad join-keys in the Visual window and fix them right there. The Data window showed a lot of the familiar summary statistics from other demos, but it allowed you to act upon them and fix data right from the analytics. There are echoes of a lot of other tools in Project MAESTRO, and I certainly can’t wait to get my hands on a build to see if they’ve achieved the right combination of features and experience to make this the right tool for most data analysts.
Tableau for Linux
I think I heard a cheer from our IT Services team when this announcement was made, because the Penguin has arrived. Tableau Server on Linux is already in alpha and will be arriving in full production next year. This should prove a huge win for IT and Devops in many companies, reducing licensing costs and administrative burden.
Let’s Talk!
Want to talk more bout all the new features in Tableau and how they’ll affect the way you use the tool? We’d love to chat! Drop us a line, and we’ll get back to you shortly. If you’re new to Tableau, we’d love to show you even more.