
It’s a data nerd’s favorite time of year! That’s right, the 2017 Tableau Conference has come and gone with all the updates and announcements you crave. Don’t forget that you can be part of the action via Tableau’s conference site, where videos from keynotes and sessions are available to stream now!
Last year, Tableau gave us an ambitious three-year plan for an expansive vision. This year, Tableau showed us how fast they are executing their vision. This vision was heavily emphasized again during this year’s keynote. Tableau is executing faster than ever before and is delivering both the small detail features that make our lives better, as well as giving us the large architectural changes that push us forward.
Hyper and Maestro have gone from promise to a reality. Extensions will bring new third party support and open up new ways to leverage Tableau as a platform. Tableau’s Web Authoring feature continues to approach parity with Desktop. The return of viz in Tooltip, a new viz type, and many other exciting updates were all the biggest takeaways from the keynote. So, let’s dig into all the goodies!
The Big Three
Tableau’s Vision Keynote kicked off the week by focusing on three key features: Hyper, Maestro and Extensions. Each of these is a leap forward in how Tableau can impact a business. Hyper brings increased speed and performance. Maestro tackles data prep issues by making it visual and intuitive. Finally, the Extensions API will allow third parties and internal developers to extend Tableau as a platform for analytics.
Hyper was demoed in style by the German team. I have a feeling we’ll see more of them, given their huge technical achievement while providing one of the most entertaining demos of the conference. What is Hyper, exactly? It’s a new columnar, in-memory and high-performance data platform that replaced Tableau Extracts (TDE). The change will be mostly transparent for end users, other than everything being faster. Hyper significantly improves extract refresh times, query times and overall performance.
From the demo, it also appears it will significantly help with complex dashboard calculations. Although there’s not a lot to divulge about Hyper (it’s fast and will help performance for all users), the impact it will have on your analytic experience and Tableau’s ability to add features, cannot be overstated. While waiting for Hyper, you’ll want to plan for an infrastructure review to ensure you have enough RAM to receive the promised performance when it arrives in version 10.5.

Above: Hyper facing off against TDE onstage.
Maestro solves a key problem in the analytics workflow: how do I get my data ready for Tableau? It’s not surprising that it takes many of its design cues from Tableau’s Connection Pane in Desktop. In many ways, Maestro represents a supercharged version of that experience. This should allow more users to get into this new tool to quickly.
The demo showed off a few key features. First, when you connect, you’ll get a profile view of your data. This allows you to quickly see the shape of your data in a summarized view. Plus, the ability to see the distribution of values, missing values, outliers and other summary stats, helps you gain early control of your data.
Above: A quick look at Maestro.
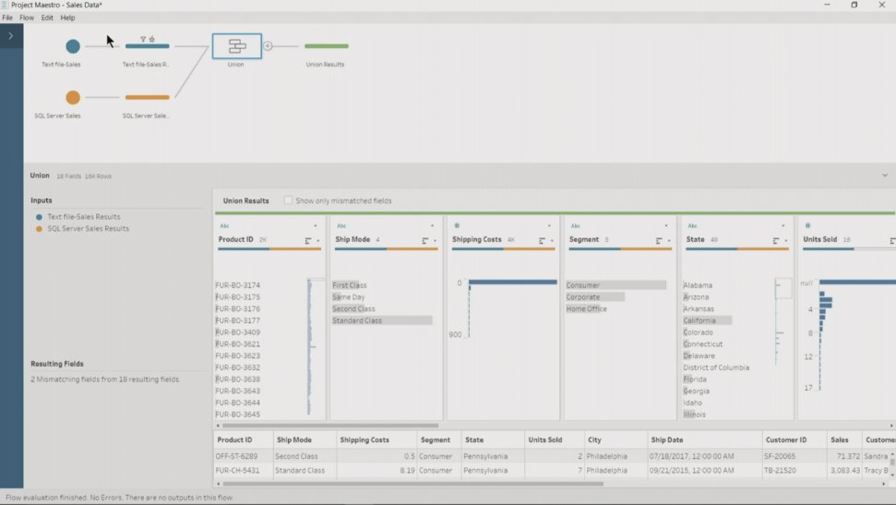
From the profile view above, Maestro allows you to start manipulating your data almost immediately. In a few clicks you can remove outliers, group fields in intelligent ways (like by pronunciation) and correct values. Tableau is also bringing its signature visual flair to the union and join process. When you choose to union two datasets with drag and drop, Tableau will visually show you any mismatched fields.
Joins take things a bit further, giving you intelligent recommendations on the join clause and a complete summary of the resulting dataset for your chosen criteria. It’s very common for users to accidentally exclude data with an incorrect join. These visual summaries of excluded data in Maestro will help ensure you’re looking at the data you want.
My favorite feature is that from any point in your data flow, you can right-click and open it in Tableau Desktop. This seamless transition should help keep us in the analytics flow. There are still a lot of questions that a five minute demo can’t answer, but we’ll know more when Maestro goes into beta this quarter.

Above: Example of join results.
The Extensions API is a giant announcement. Providing more hooks for developers is going to allow the Tableau community to create more powerful and innovative experiences than ever before. Your dashboards will now be able to act as fully-fledged apps within Tableau Desktop. The keynote demoed such features as database write-back, data catalog integration, deeper analytic capabilities and automatic textual summaries of your dashboard. These only give a glimpse into the capabilities via the API.
Third-party tools you love can now integrate deeper into Tableau. But you’ll also be able to make Tableau a cohesive part of your own internal processes. This feature will mean the ability to create better analytic experiences, more complex analytics and more powerful tools. I’m extremely excited to see what the community does with this capability. The Extensions API is available now in developer preview.

Above: Demonstration of the Extensions API
Design and New Ways to Viz
The Devs on Stage session focused on certain tweaks that will make each day a bit better for analysts. First up, Tableau is adding easy Nested Sorting, a long-requested feature. You’ll no longer need multiple steps to display your data the way you want. This will open up the opportunity for consumers to perform this action as well.
There was a standing ovation among the InterWorks viz experts when the design updates were announced. The added ability to overlay a grid on dashboards is a huge win for all of us attempting to make sure everything is aligned. Combined keyboard nudging to create a pixel-perfect design is now only a few taps on your arrow keys away.

Above: The new grid in action.
Another long-awaited feature, Viz in Tooltip is available in the 10.5 beta. This feature has made an appearance before, but it should prove to be a revolutionary feature. Allowing users to add Tableau worksheets within Tooltip will bring new levels of interactivity. With many details hidden from view, this should allow for even cleaner dashboards. I look forward to the creative use cases the community comes up with and can’t wait to start implementing this for clients.
More Ways to Map

Above: Viz in Tooltip.
Geospatial capabilities got a significant boost as well. The Density mark provides a new way to visualize dense data on maps or in scatter plots. This allows us to take hundreds of thousands of points and make sense of them quickly and intuitively. Not only does it look amazing, but it provides a powerful way to bring insight to a complex data type.
Tableau also added plenty of back-end geospatial capabilities, allowing spatial data to be pulled directly from your database. This will not only make it easier to visualize geospatial data, it will also enable powerful new abilities like spatial joins.
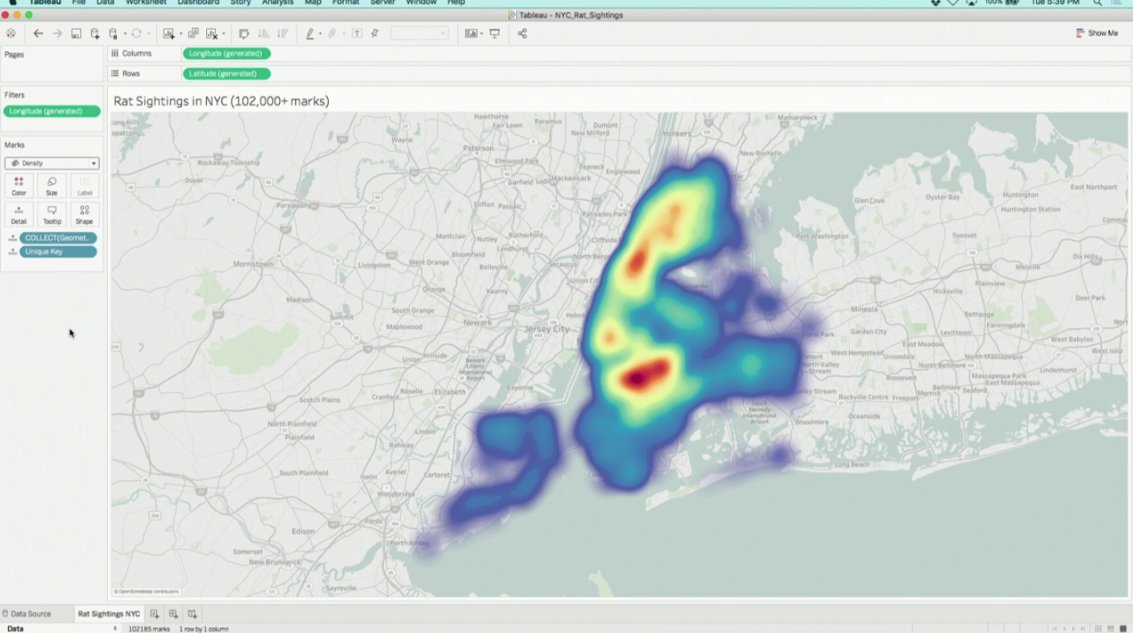
Above: Density for maps
Enterprise Feature Brings the Heat
You may have heard that Tableau on Linux is coming and that it’s creating a lot of joy. We’ve already covered this update, but Linux support has been a highly requested feature and should be a great option for many organizations. There’s even more love for our beloved Tableau Server admins, with many configuration options exposed via the browser and allowing changes without a restart. This means less downtime, fewer interruptions and happier business users.
These Tableau Server Management items will also be scripted, allowing for more flexibility and automatic configuration of your Tableau Server environment. With these new abilities, it’s possible to have a Tableau Server environment provide the optimal user experience during the day, but transform itself overnight to focus its power on refreshing Tableau data sources.
Finally, many of us have multiple versions of Tableau Desktop running on our computers to ensure we can use the latest and greatest features while maintaining compatibility with servers and other users who have yet to upgrade. In 10.5, you’ll have the ability to export and publish to previously supported versions of Tableau.

Above: Devs on Stage.
Whose Data Is This Anyway?
Finding the right data for an analysis is the first and often biggest problem facing projects. Tableau is helping the process by creating Data Source Certification, which is available today in version 10.4. This makes sure you know the data you’re using for analysis is trustworthy. Also, each dashboard will now have an easy-to-access list of data sources that link to Tableau’s brand new Data Source page. The Data Source page will give you unique visibility into all the details of your analysis: fields, hierarchies, calculations, certifiers and more.

Above: Data Source page.
Utilizing all of this information about your datasources has enabled Tableau to provide data source recommendations. When creating a datasource, Tableau will now provide recommendations on the tables you might be interested in based on certification, shape of the data, common joins and other information. Tableau is also exposing the data page for each datasource in Tableau Desktop, so you can easily see information such as popular fields or how many people are using it. All of this together will make the tool easier to use and easier to find the right data for your project.
More Ways to Organize and Share
Tableau Server’s organizational structure has always been easy to understand: you create projects and workbooks belong to them. In larger environments, these levels of hierarchy easily become complex and hard to navigate. Now, projects act more like folders on your desktop, so that you can have projects within projects. Nested projects gives you as many levels of hierarchies as you need for your environment. The bottom line is you now have a more flexible and powerful organization.

Above: Nested projects.
One of my favorite new abilities is the annotations capability via the Tableau mobile app. The ability to mark directly onto a visualization with specific feedback is going to make our design review process more efficient and exact. This means you can circle specific issues, type out comments and leave the almighty emoji to make sure they know exactly how you feel. This may seem like a secondary feature, but it promises to help us collaborate more effectively and hopefully create some better dashboards in the process.

Above: Mobile Annotation tool at work.
Just Getting Started
Tableau has always been renowned for being easy-to-use, but many organizations still find it a big task to get an initial batch of dashboards created and ready for production. Between figuring out the data, learning a new tool and producing a quality analysis, it’s easy for momentum to begin to slip. Prebuilt workbooks help keep the momentum going by giving a suite of dashboards for common datasources right at your fingertips. This includes common datasources such as ServiceNow ITSM, Salesforce, Quickbooks Online, Oracle Eloqua, Marketo and Google Analytics.
Join the Betas
Many of the features here are available in versions 10.4 or 10.5. If you can’t wait to start getting your hands on these new features, join Tableau’s beta!