

Today we continue exploring Tableau’s interface. We will focus on the functionality and features of the Sidebar, commonly known as the Data Window among Tableau users.
The Sidebar
The Sidebar is located on the left-hand side of the Tableau worksheet (depicted in Figure 1 below), just beneath the drop-down menu options and the Toolbar.
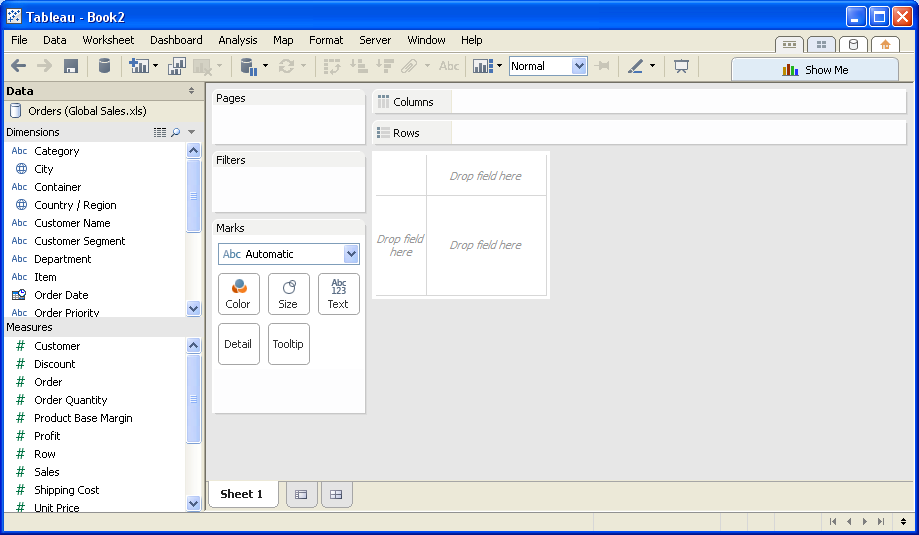
Figure 1: Tableau Worksheet
Sidebar Features
Figure 2 shows a detail of the Sidebar. It includes the active data sources under the Data heading, the selected data source dimensions under the Dimensions heading, and the selected data source measures under the Measures heading.
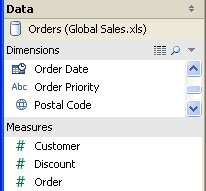
Figure 2: Data Partition
The Sidebar has a little pair of arrows in the top right-hand corner. Clicking these arrows will minimize the Sidebar, hiding it from your Tableau worksheet.
Returning it to your worksheet is quite easy. You can go to the Window drop-down menu and select Show Toolbar. A checkmark will appear to indicate it is visible. Or, if you look at the bottom left corner of the Tableau worksheet (see Figure 3), you’ll find those same little up and down arrows.
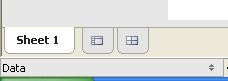
Figure 3: Minimized Sidebar
Click on those arrows to un-minimize the Sidebar. Personally, I wish someone had told me that the first time I accidentally minimized my Data Window. So, you’re welcome.
Data Partition
At the top of the Sidebar is the Data partition where all connected data sources are displayed. In this figure, only a single Excel data source is connected. It appears like this:
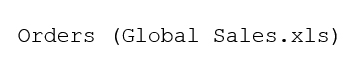
Global Sales.xls is the name of the Excel data source and Orders is the selected worksheet within that document. In addition, the icon next to the name of the data source also denotes information. In this instance, Tableau has a live connection to the data source.
Dimensions
Beneath the data partition are all the dimensions of your active data source. Dimensions are your categorical fields – ways that you will want to parse your data. Dimensions give us our header and footer labels in a view. They are discrete. Tableau notes discrete fields with blue icons.
What is a discrete field? Find more info on that here.
Dimensions include fields that have numbers inside of them, but these fields contain items you might want to count up and not apply another type of aggregation to, such as a postal code or a unique identifier field (i.e. Customer ID).
At the top of the partition, there are three buttons in the Dimension header. The first is the View Data button. Clicking on this will produce a new window with your unformatted data source in a spreadsheet. The magnifying glass is the Find Field button, which allows you to type in the name of a field to help pare down the list of dimensions and measures from a suggestion box. This helps you find the field you’re looking to use. Lastly, the down arrow opens up a drop-down menu with additional options.
The blue icons (because they are discrete) next to each dimension denote information about that field. An “Abc” indicates that the field is a text/string value, such as Customer Name or Department. A globe indicates that it is a geographical field, such as State or Country / Region. Finally, the calendar icon indicates that it is a date measurement, such as Order Date or Ship Date.
Tableau automatically generates a new dimension for each data source, known as Measure Names. It is a field that includes all the names/labels of your measures. We’ll cover how you can use Measure Names in future articles.
Any dimension that Tableau generates is formatted in italics for easy reference. In addition, you can right-click on any dimension to bring up a contextual menu for further options.
Measures
Followingd the Dimensions partition is the Measures partition. It includes all of the numerical fields from the currently active data source. They are the fields in your data source that you will use to compute some type of aggregation. Measures also give us the axis in our visual. These fields are noted with a green icon because they are continuous.
Learn more about continuous fields here.
The difference in color between discrete and continuous is useful when you’re dragging and dropping these fields into your worksheet.
While Tableau is pretty smart about figuring out which fields belong where and what they are meant to do, there is a limit to how much it can do. For example, you may have a unique identifier field in your data source that is a series of numbers. Tableau will put this field in the Measures section of the Data Window, yet you know your data best and know that this field is actually a dimension. So, drag the field to the Dimensions section!
You can organize your data even more by right-clicking to bring up the context menu and selecting Default Properties > Default Aggregation and Number Format. There you can designate that measure to be an average, format as currency or any other number of options to help save you time down the road as you use this measure again and again.
If you are going to use this data frequently, save your workbook as a Tableau Data Source. By doing this, all the metadata that you’ve created for specific fields can be used over and over.
Tableau automatically generates several additional measures. The first pair is the Longitude and Latitude measures, which are automatically generated from the geographical dimensions above. These are useful when you use map views with your visualizations. They are denoted by a globe like the geographic dimensions.
The next generated field is the Number of Rows, which is simply the number of rows in your data. Lastly, Measure Values is similar to Measure Names. It contains the values of each measure.
Mastering the Basics
The best way to master all of these tools and features is to practice, practice, practice. Tableau is designed to be intuitive and easy to use. Refer back to this article and our entire Tableau Essentials series as a reference if you need a hint or clarification.
Here are the other Tableau Essentials posts we have so far:
- The Toolbar (Interface)
- The Worksheet Canvas (Interface)
- Measures & Default Properties
Drop us a line if you have questions, requests or simply need help with a bigger project!
The Latest
-

Kickstarting Data Innovation in Healthcare
18 April, 2024