

The Worksheet Canvas
For the Tableau Desktop Interface (see Figure 1), we have covered the Toolbar and the Sidebar. Today, we will examine the rest of the worksheet, focusing on all of the options and controls from the Worksheet Canvas.
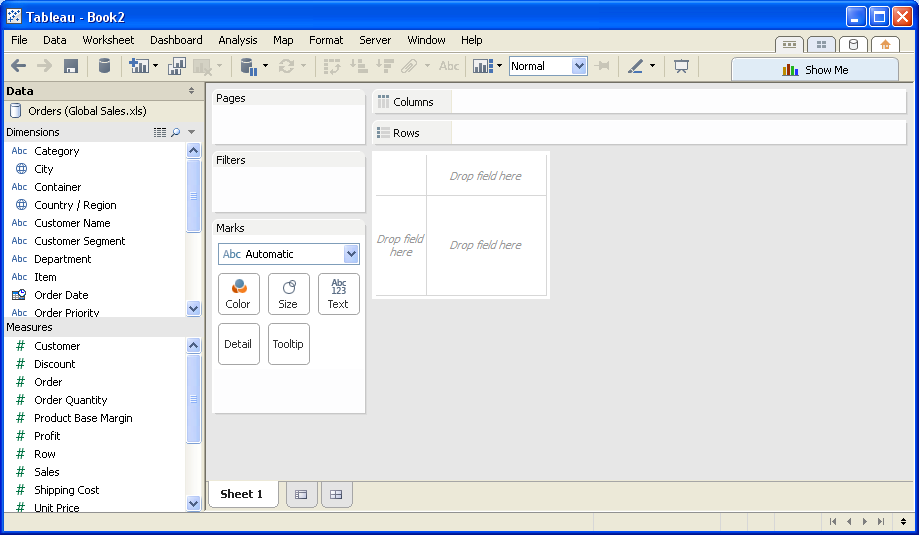
Figure 1: Tableau Worksheet.
Cards & Shelves
We’ll only do a quick overview here, as this is the heart of Tableau’s interface and cannot be covered in full detail in just an overview article. The Columns and Rows shelves are the holders of your dimensions and measures. Any field that you drop here will immediately appear in the visualization Tableau thinks best fits your data. Depending on the different options you select, you can see additional icons or features on these shelves.
You can also drag your fields directly onto the white placeholder table below – on the left for a row and the top for a column.
The rest of the canvas contains the Pages and Filters shelves, followed underneath by the Marks card. You can turn their appearance on or off in the Window drop-down menu. As always in Tableau Desktop, if you right click on any of these, you will find a contextual menu of options.
Worksheet Tabs
At the bottom of the worksheet canvas is a series of bottom tabs. See Figure 2 as an example.
![]()
Figure 2: Canvas Tabs.
The first two tabs, Sales and Shipping, are worksheets. Sales, in bold, is the active tab. Next, noted with a grid icon, is a dashboard tab. In this example, this tab is simply called Dashboard. You can have several worksheet or dashboard tabs in a single workbook.
You can create a new worksheet here by clicking the second to last tab. Finally, you can create a new dashboard by clicking the last tab that appears to be an equally-sized grid of four cells.
There are numerous ways to create a new worksheet or new dashboard beyond these controls, including using the drop-down menus at the top of Tableau Desktop as well as by right-clicking.
Top Options
The last area we will cover in this article is the top right-hand options. There are five clickable areas. The first four are the navigational tabs for Tableau Desktop. They are numbered from 1 to 4.
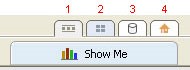
Figure 3: Top Options.
- Worksheet: This is your currently active view, the Tableau worksheet.
- Thumbnail View: The thumbnail view will show you a grid of all of your worksheets in this Tableau workbook. The thumbnail view is a quick and easy way to find a particular sheet if you’re working with several workbooks or if you can’t remember the name.
- Connect to Data: The Connect to Data tab takes you to the Connect to Data screen where you can connect to another data source.
- Home: This tab will take you to the home screen of Tableau.
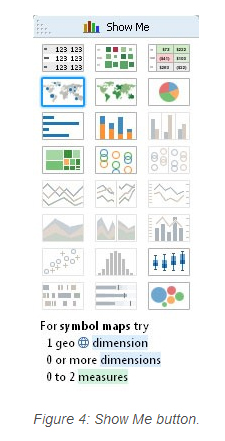
Show Me
Finally, beneath these four navigational tabs is the Show Me button, easily identified by the multi-colored bar chart icon. Clicking on this will show all of the visualizations available in Tableau. Tableau will gray out all of the varieties that are not applicable to your data and color the ones that are available.
See Figure 4 on the right.
Clicking any of these different styles will automatically change your data presentation to that type. You can customize it further by switching your row-column axes, formatting your cells, sorting and more. Tableau will automatically select the visualization that it thinks best suits your data based on the fields you have selected in the worksheet so far.
Remember, if you click a visualization that you do not like, you can simply choose another or click the Undo button in the Toolbar.
Mastering the Basics
This concludes the interface overview of the Tableau Essentials series, but we’re just getting started. We have many Tableau Essentials blogs posts in the works to help you master the Tableau basics.
In the meantime, check out our other Tableau Essentials posts:
- The Toolbar (Interface)
- The Sidebar (Interface)
- Measures & Default Properties
Let us know if you have any questions about the Worksheet Canvas or Tableau in general. You can leave these in the comments section below or contact us directly. We look forward to hearing from you!
The Latest
-

Kickstarting Data Innovation in Healthcare
18 April, 2024