
Not everyone is a Tableau guru, at least not yet. To help Tableau rookies, we’re starting from square one with the Tableau Essentials blog series. The series is intended to be an easy-to-read reference on the basics of using Tableau Software, particularly Tableau Desktop. Since there are so many cool features to cover in Tableau, the series will include several different posts.
One of the great features about Tableau Software is the ease in utilizing maps for your visualizations. There are two chart types to choose from when creating a view with geographic data: symbol maps and filled maps. In this article, we’ll cover symbol maps. These are simply maps that use a type of mark to represent a data point, such as a filled circle.
Note: Tableau 8.1 was used to create the map images in this blog post. For more on changes to maps in Tableau 8.2, see our post here.
Before we get started, in the upper left-hand corner of the map is a navigation tool:

This tool has four controls. They are (starting from top to bottom): zoom in, zoom out, zoom into a selected area using a click-and-drag and reset map. For a more controlled zoom in and zoom out, hold CTRL and scroll with your mouse wheel. These controls will help you and your report viewers navigate around your view, particularly if you’ve got a lot of detail spread across the globe. To pan across your map, hold SHIFT and left-click drag your mouse across your screen.
Example: Where Do World Cup Players Play Club Soccer?
For our symbol map example, we’ve created a database of all of the players from the 2014 FIFA World Cup – the world’s greatest sporting spectacle. The final tournament features 32 national teams from around the world. So, where do these national team players, presumably among the very best in the world, play their club soccer?
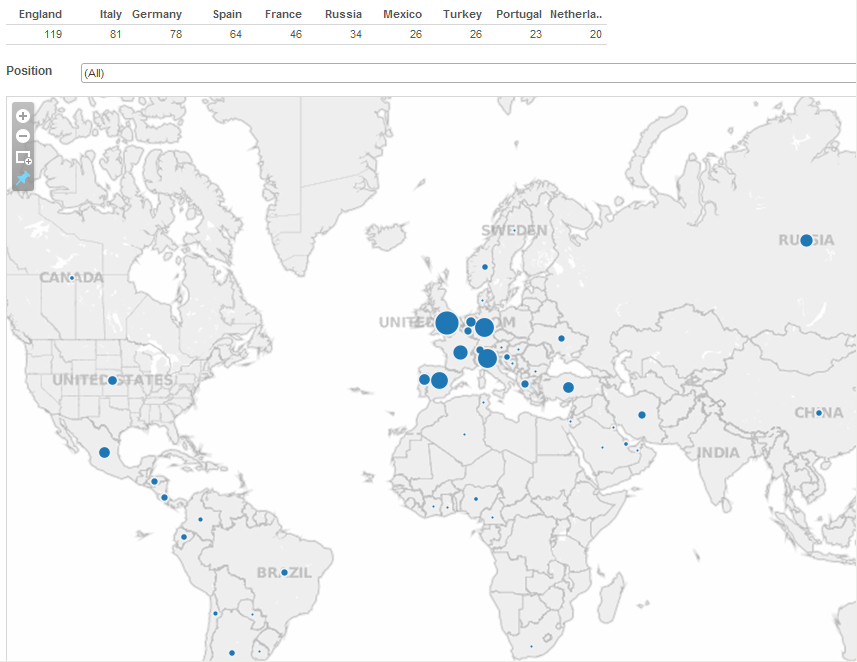
Figure 1: Symbol map.
The larger the circle, the larger the player count. To avoid the clutter of labels in such a densely-marked area such as Europe, we’ve added the symbol map to a dashboard. This dashboard has a text table summing up the top 10 countries at the top along with a positional filter (defense, midfielder, attacker and goalkeeper). If you follow international soccer, it’s no surprise that England (119), Italy (81), Germany (78) and Spain (64) are tops. Out of the top 20 most valuable soccer clubs in the world, 19 of them belong to these four leagues. Show me the money!
The closer we zoom in, the more geographic detail Tableau will provide on our map. Let’s focus on Western Europe, where the majority of players make their money.
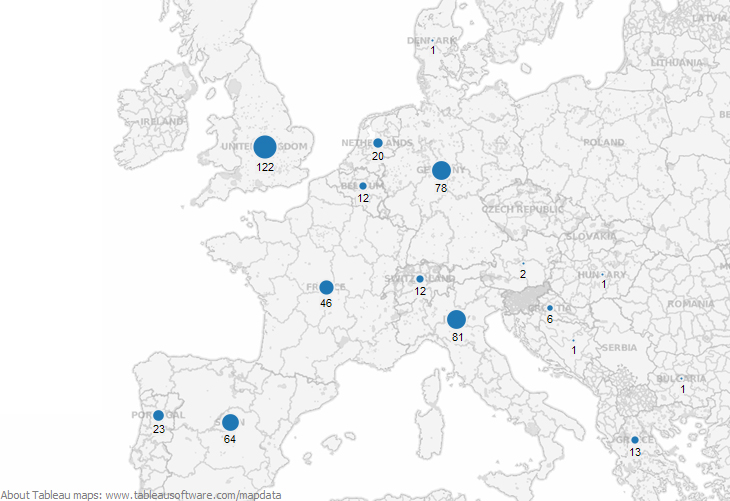
Figure 2: Continental zoom.
With this closer view, you can now see the sub-region divisions within each country. In fact, you can get a lot closer. Let’s break out each country’s clubs into cities and see what happens when we do that for the 122 club players in the UK.
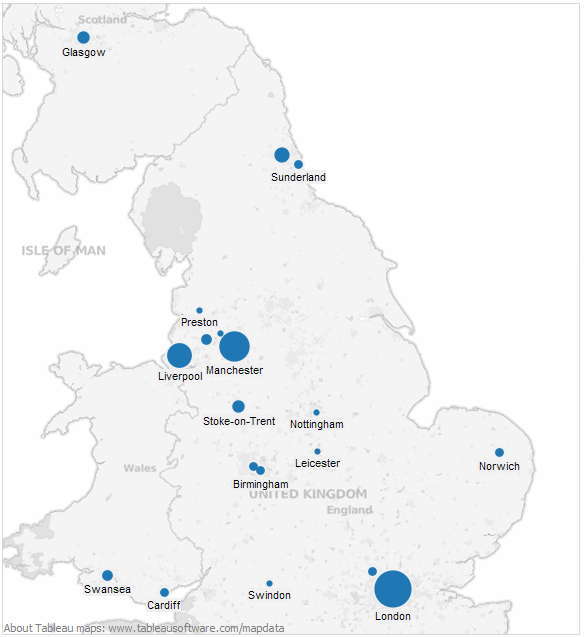
Figure 3: Country zoom.
The density of World Cup players’ club locations in the UK is led by London (36), with Manchester (24) and Liverpool (16) following closely behind. Those are the homes of the top clubs in the UK – Arsenal, Liverpool, Manchester United, Manchester City, Everton, Tottenham Hotspur, etc. You can see that Tableau can give a great degree of geographic specificity to your data.
You can go even deeper:
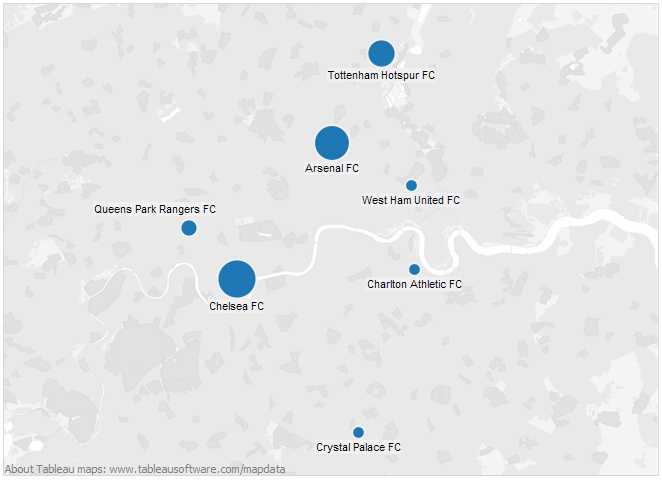
Figure 4: City zoom.
Above is the city of London with the River Thames running right through the middle of the map. The dark grey patches are gardens, parks and reserves within the city. You could add more detail to this map by selecting the Map menu and exploring the Map Options panel.
Map visualizations are one of the truly innovative features of Tableau Software. With the standard level of automation and intuitive controls, you can add genuine business insight with stunning views.
Other Chart Types
Here is the complete list of chart types from the Show Me menu. Be sure to check back often as we continue to release new articles in each chart type in this sub-series.
- Text Table (Crosstab)
- Heat Map
- Highlight Table
- Symbol Map
- Filled Map
- Pie Chart
- Horizontal Bar Chart
- Stacked Bar Chart
- Side-by-Side Bars
- Treemap
- Circle Views
- Side-by-Side Circle Views
- Lines (continuous & discrete)
- Dual Lines
- Area Charts (continuous & discrete)
- Line Chart Extra
- Dual Combination
- Scatter Plot
- Histogram
- Box-and-Whisker Plot
- Gantt
- Bullet Graphs
- Packed Bubbles
More Tableau Essentials
Want to learn more about Tableau? We have several posts outlining all of Tableau’s fantastic features. Check out the full list on our Tableau Essentials blog channel.
As always, let us know if you have any questions or comments about this post or Tableau in general. If you’re looking for personalized training or help with something bigger, contact us directly!