Not everyone is a Tableau guru, at least not yet. To help Tableau rookies, we’re starting from square one with the Tableau Essentials blog series. The series is intended to be an easy-to-read reference on the basics of using Tableau Software, particularly Tableau Desktop. Since there are so many cool features to cover in Tableau, the series will include several different posts.
The packed bubbles view, also known as a bubble chart, is a means to show relational value without regards to axes. The bubbles are packed in as tightly as possible to make efficient use of space.
There are a lot of different ways to use this information, particularly with a data set that uses a large variety of fields, but we’ll start with a fairly simple view.
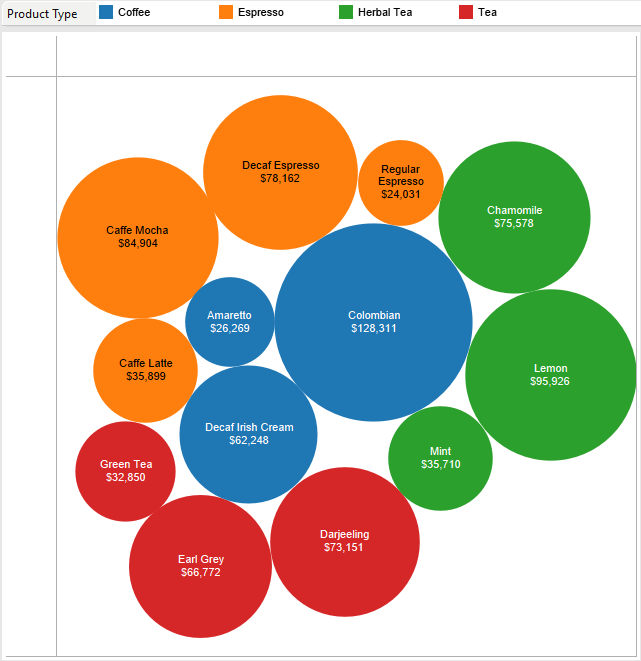
Above, we are looking at various products within Product Types. The arrangement of the bubbles is out of our control, but we can control how big the bubbles are by putting a measure on Size (in this case, I used Sales). The key to making bubble charts useful is having the right fields in the right place on the Marks card, specifically on the Color, Size and Detail shelf.
Let’s expand our data set to see more bubbles on the screen in a single view so we can get a better idea of how a packed bubble chart organizes a larger scope of data.
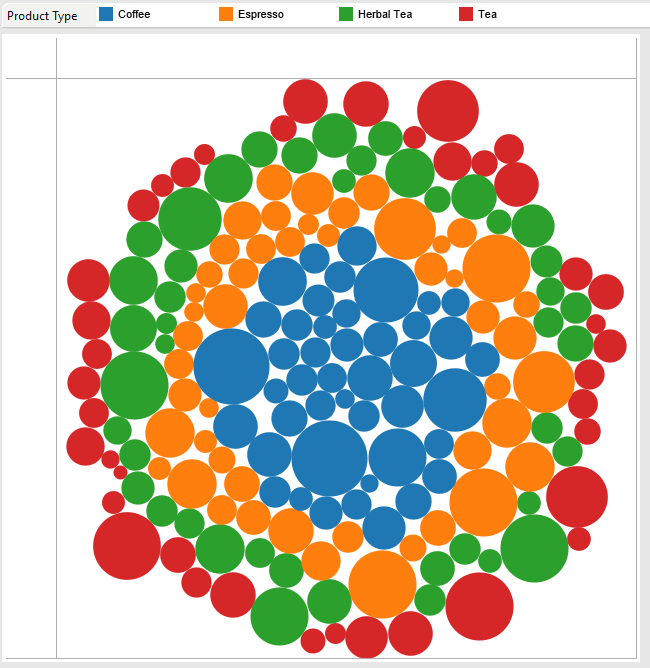
Above, I added State to Detail to add more information to the first bubble chart. Now, we get one bubble per Product, Product Type and State. Note the arrangement of the bubbles. Again, we cannot manually move bubbles around.
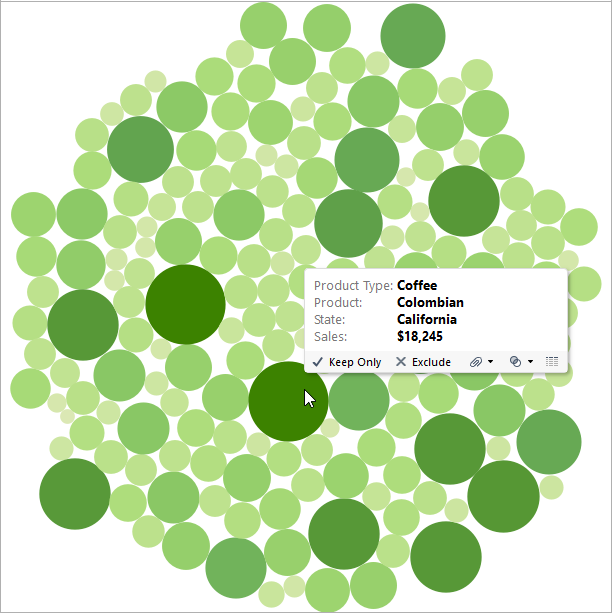
A bubble chart can be a way to see a number of values in relation to another – all depends on the fields you use on the marks card. In the view below, I have the same fields on the Marks card as above, but I swapped out Product Type on Color for Sales. We see a couple of the larger circles in a dark green shade, indicating high sales. Want to know more about why that bubble is dark green? Here’s where we benefit from the amazing tool tips! The tool tip contains all of the information we may want to know about a point, but doesn’t take up space in the visualization when a mark is not selected.
Hopefully, this article illustrates a few of the uses for a bubble chart. As you can see, they’re a fun break from axis-based charts. Play around with your own bubble charts and see what combinations you can come up with.
Other Chart Types
Here is the complete list of chart types from the Show Me menu. Be sure to check back often as we continue to release new articles in each chart type in this sub-series.
- Text Table (Crosstab)
- Heat Map
- Highlight Table
- Symbol Map
- Filled Map
- Pie Chart
- Horizontal Bar Chart
- Stacked Bar Chart
- Side-by-Side Bar Chart
- Treemap
- Circle View
- Side-by-Side Circle View
- Line Charts (Continuous & Discrete)
- Dual-Line Chart (Non-Synchronized)
- Area Charts (Continuous & Discrete)
- Scatter Plot
- Histogram
- Box-and-Whisker Plot
- Gantt Chart
- Bullet Graph
- Packed Bubbles
More Tableau Essentials
Want to learn more about Tableau? We have several posts outlining all of Tableau’s fantastic features. Check out the full list on our Tableau Essentials blog channel.
As always, let us know if you have any questions or comments about this post or Tableau in general. If you’re looking for personalized training or help with something bigger, contact us directly!
The Latest
-

Kickstarting Data Innovation in Healthcare
18 April, 2024