
Not everyone is a Tableau guru, at least not yet. To help Tableau rookies, we’re starting from square one with the Tableau Essentials blog series. The series is intended to be an easy-to-read reference on the basics of using Tableau Software, particularly Tableau Desktop. Since there are so many cool features to cover in Tableau, the series will include several different posts.
Tableau tooltips are a fantastic way to add additional context or information to your view without taking up any precious real estate on the worksheet (super important when the worksheet is on a dashboard). As we’ll discuss in this post, you can populate the tooltip with as much information as needed including dynamic fields —fields that will update when the user clicks on or hovers the mouse over a mark in the view. As a result, tooltips are very useful in building interactivity and reinforcing your story for your views.
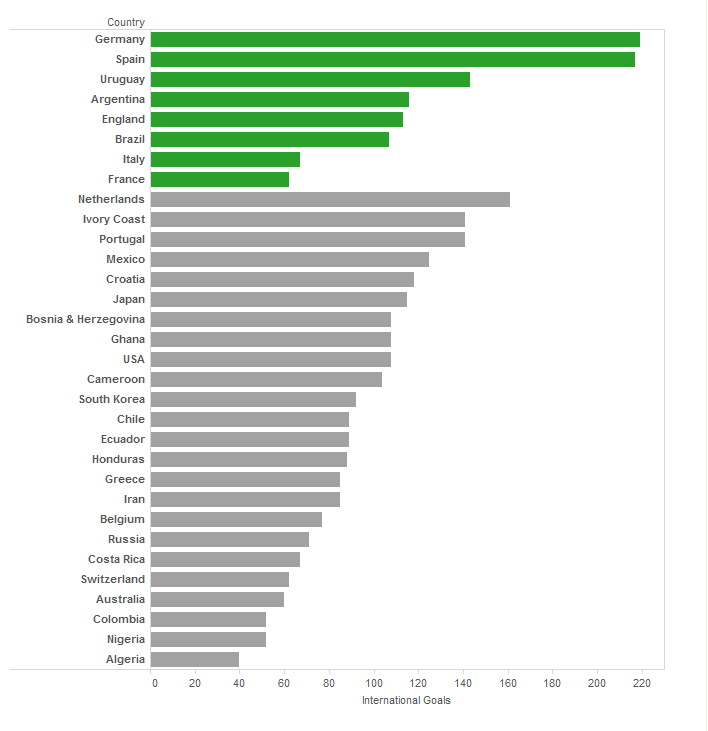
Let’s start with this horizontal bar chart that depicts the total international goals from each World Cup country’s twenty-three man roster.
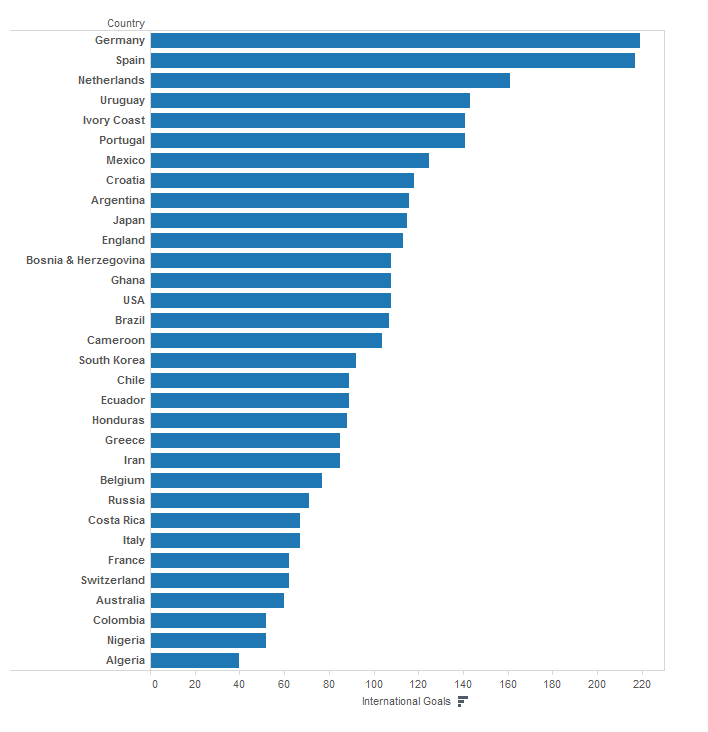
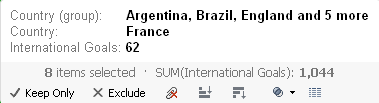
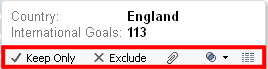
This is a very simple chart, but we’re more interested in the tooltip. Clicking on the bar for any country will bring up Tableau’s default tooltip:
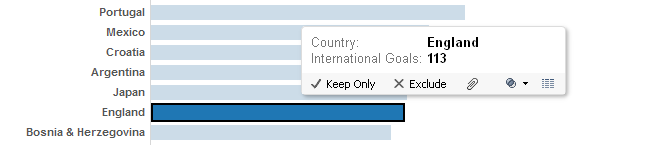
The default tooltip includes the Dimension (Country) and the Measure (SUM(International Goals)) on the column and row shelves respectively. Running along the bottom are the control buttons, which allow you to Keep Only this bar/item (England in this example), Exclude this bar/item, Group Members, Create Set, and View Data.
Most of those are fairly self-explanatory, but let’s use the Group Members tool. I’ve clicked on the bar of each of the countries in the chart that have won the World Cup and grouped them. Here’s how it affects the view:
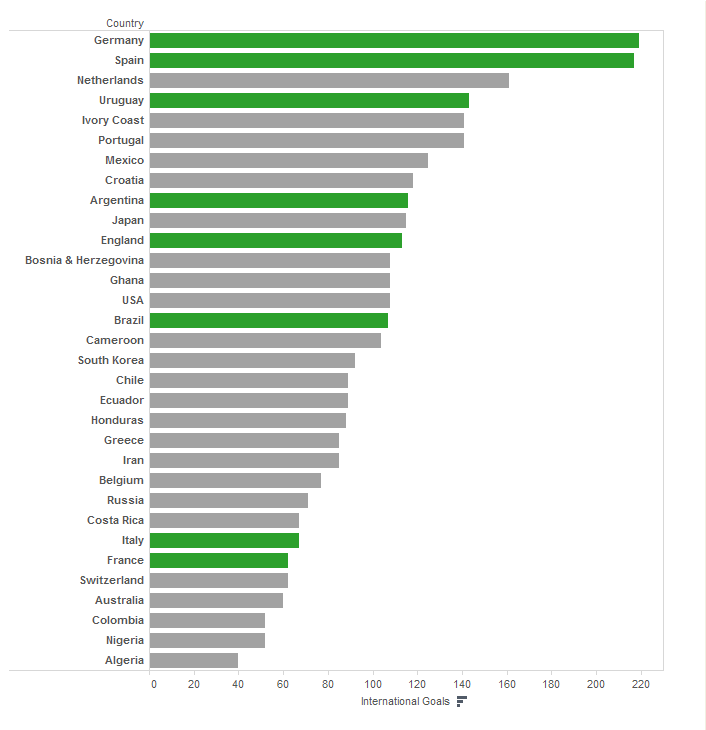
The items in the selected group of World Cup winners have been assigned a color (default is blue, but I changed it to green to match a soccer field) while the rest of the table is left in gray. By selecting each of these countries, the tooltip offers us a couple of new options: Ungroup and two sort options.
Clicking on the Sort Descending button will resort the table based on the groups:
Now that we’ve covered the basics of the tooltip’s functionality, let’s take a look at how the tooltip is built inside of Tableau Software and how we can modify it.
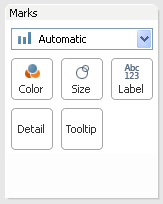
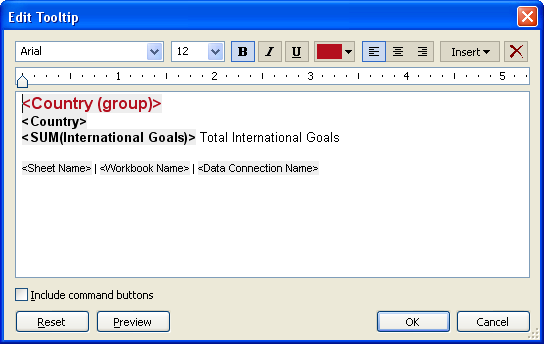
Clicking on the Tooltip button in the Marks card will bring up this window:
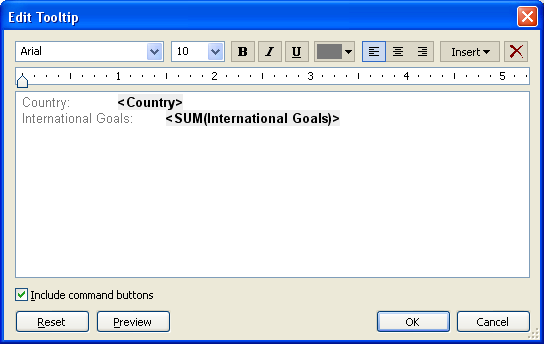
The content of the text box is based on the chart, listing the fields currently used in the view by default. The fields in the box above are designed in brackets, such as
- Font Type
- Font Size
- Bold
- Italics
- Underline
- Font Color
- Alignment
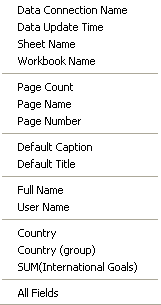
You can also use the Insert menu to quickly insert new measures and variables into your tooltip. The list of elements to insert is built based on your data source and your current visualization. Here is what that Insert menu looks like for our table:
As an example, inserting the data update time will add the field into the tooltip text box, showing your users when the data source connection was last refreshed. Finally, the last button (X) is the Clear Formatting button which will wipe all of the style selections from the tooltip. This will not erase your measures or text, just the formatting.
At the bottom of the Edit Tooltip window, the Include Command Buttons checkbox will keep or remove the options at the bottom of the tooltip that appear in the grey bar.
Now that we’ve covered the controls, we’re going to customize our tooltip. The first thing we’ve done is rename the Group alias as World Cup Champion. You can do that by right-clicking the group (Country) dimension on the Marks card. Next, we’ll make the following formatting changes with the extra fields inserted:
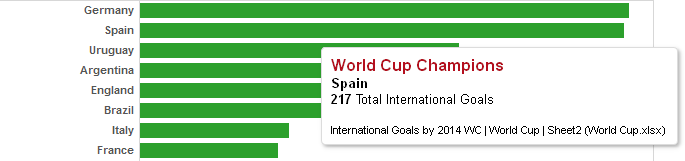
You can preview any changes you’ve made to the tooltip by clicking the Preview button. Here’s how our changes will look in the tooltip:

We’ve changed the color, size and variables, which add more information to each tooltip. If there are additional fields that you’d like to display, perhaps the number of players or the name of the captain of the team in this case, you can drag and drop those fields on the Tooltip shelf in the Marks card, and they will appear in the Insert menu for you to add in. As I mentioned earlier, tooltips can contain as much information as you need — perhaps you fill the box with fields and additional text so much that when the user clicks on or hovers over a mark, the tooltip takes up the whole screen!
Obviously with so many different options, there are a lot of ways you can use tooltips. Let us know if you have any clever or inventive ideas on using tooltips.
Formatting Tips
Below is a complete list of Formatting Tips posts that can help you transform your vizzes into works of arts. Check back frequently for new additions.
- Custom Shapes
- Labels
- Color
- Tooltips
- Maps
More Tableau Essentials
Want to learn more about Tableau? We have several posts outlining all of Tableau’s fantastic features. Check out the full list on our Tableau Essentials blog channel.
As always, let us know if you have any questions or comments about this post or Tableau in general. If you’re looking for personalized training or help with something bigger, contact us directly!
The Latest
-

PYD129 – Tableau Conference History with Dan Murray
23 April, 2024