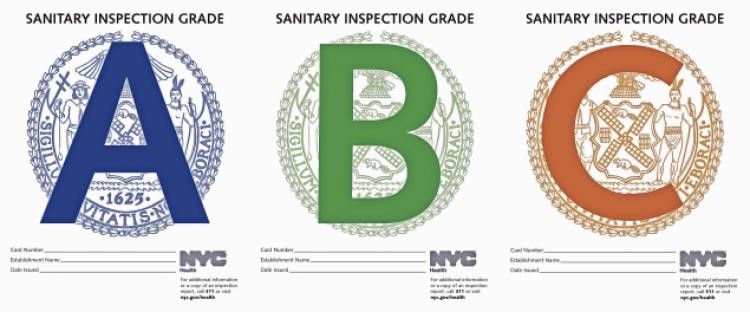
My first time to New York City, I noticed something on just about every restaurant I walked by. There was one of these signs displayed at the front window showing off the inspection grade. Obviously, I avoided every one of the C restaurants I came across, but it got me curious. Just how sanitary are the restaurants in New York City?
Data Prep in Alteryx
Grabbing data from NYC.gov, we were quickly able to pull the data down and do a little prep before it was ready for Tableau. Since Tableau cannot map street addresses as a Geographic Role, we were going to need to a batch geocoding process with Alteryx. Those of you who don’t have Alteryx can try a free version of the Alteryx Public Geocoding App to do this same process! (limited to 1000 rows)
Once we got our restaurant latitude and longitude, it was time for Tableau to take over.
Visualizing in Tableau
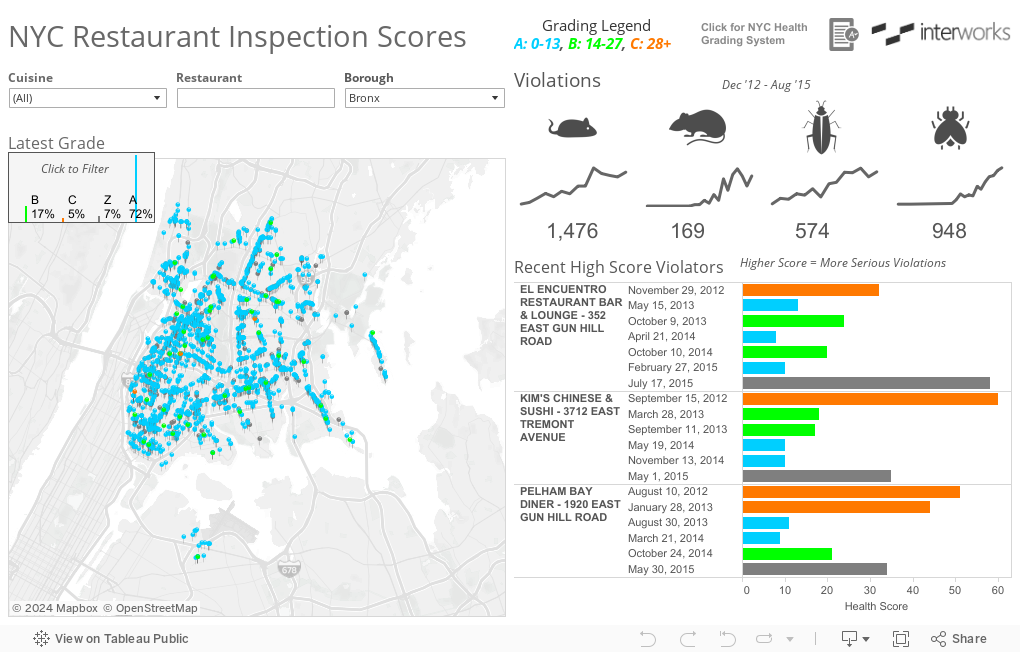
This dataset was over 200,000 rows, going from December 2012 to August 2015, so a Tableau Extract was created to give us the performance we’d need to dig into the data and see if our favorite restaurants were safe to eat at.
After exploring and just playing around with the data, it became clear that not all sanitation violations are equal and that it was going to require a little bit of reading to understand how NYC.gov scores their inspections. A full guide can be found at the NYC.gov website.
The first thing we noticed was that the scoring system started at 0. The higher the score, the more serious of a violation occurred. 0 to 13 is an A, 14 to 27 is a B, and 28+ is a C. We color-coded the Tableau dashboard to use the same color scheme that NYC.gov used for their grade. A is Blue, B is Green, C is Orange and Grey is a pending rating.
Thankfully the majority of the restaurants in the city have either an A or B rating. Most of the time, those C restaurants have lower scores on subsequent inspections.