
When going through training, people are often introduced to highlight tables and are immediately intrigued. That’s because they allow us to create a standard crosstab but use color to call attention to certain values (high or low). But how do we edit colors once we create a highlight table, particularly when totals are involved? Let’s walk through the process.
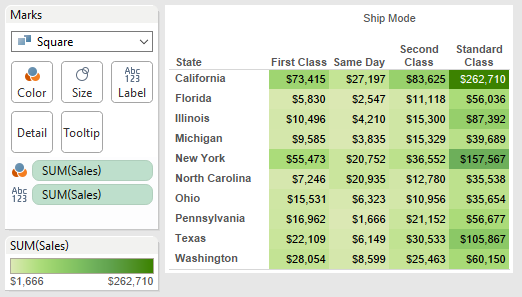
Let’s add Ship Mode to Columns, State to Rows and keep a filter for only the top 10 states with highest Sales. Next, we can turn our crosstab into a highlight table by taking another copy of Sales to Color and changing Marks to Square. Results shown below:
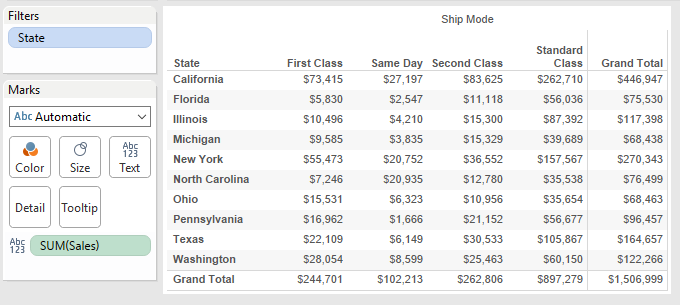
Soon after, we learn how to quickly bring grand totals to our crosstab by simply double-clicking the Totals option on the Analytics tab of the Data pane:
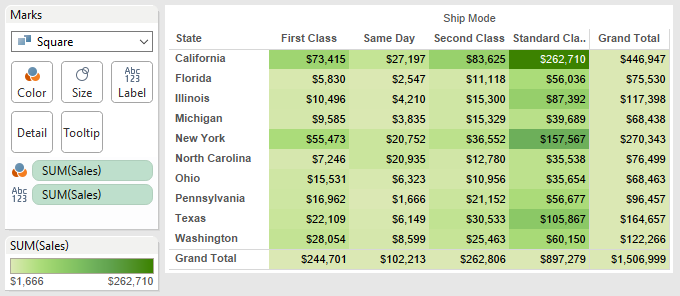
But what if we want to create a highlight table that ALSO shows grand totals? We should just be able to create our highlight table and bring in our totals, right? Not exactly. When we bring totals into a highlight table, we get a view that shows our Total Sales as the darkest cell. Who would have thought that Grand Total would be our highest value!?
How do we get around this? We need to tell Tableau to hide color from our totals by right-clicking on our Sum(Sales) associated with color navigating to the Total Using (Automatic) menu and selecting the Hide option:
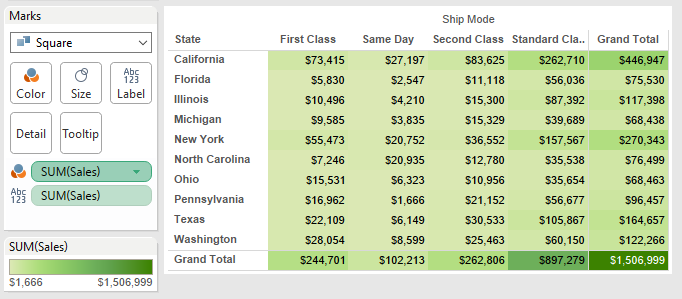
And there we have it, a highlight table that also shows off our grand totals:

Keep in mind that when using this option, Tableau will assign whatever color “Zero” is associated with. In the highlight table above, light green is our 0 value, so our totals will default to that same light green.
The Latest
-

Kickstarting Data Innovation in Healthcare
18 April, 2024