
We all know that we can create some pretty cool maps in Tableau using fields like City, State and ZIP Code; however, Tableau cannot natively map street addresses. In order to plot specific addresses, we’ll need to use latitude and longitude coordinates. Through the use of some free online tools, we can convert addresses in our data into coordinates for use in our Tableau maps.
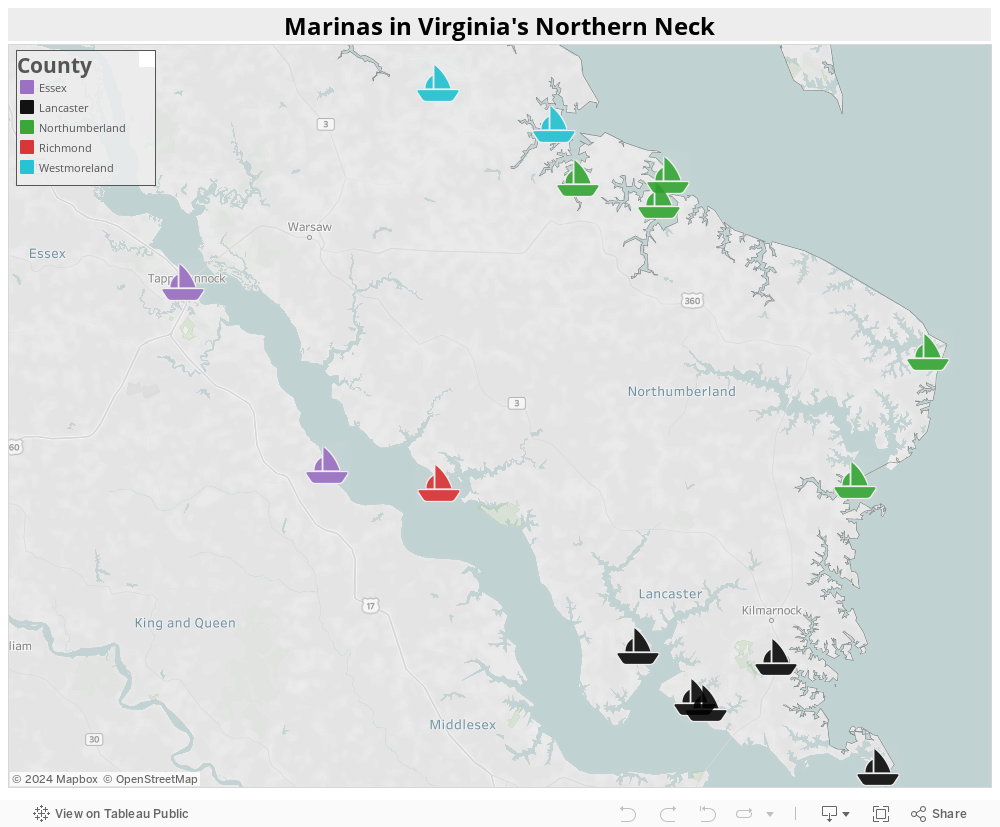
For this example, I’m going to map a list of marinas surrounding my hometown of Warsaw in Virginia’s beautiful Northern Neck.
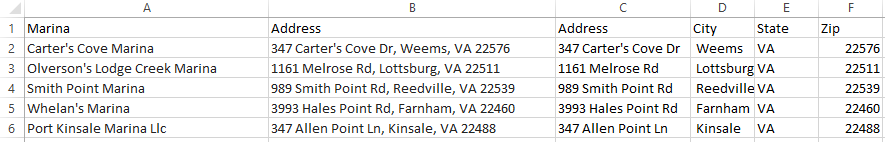
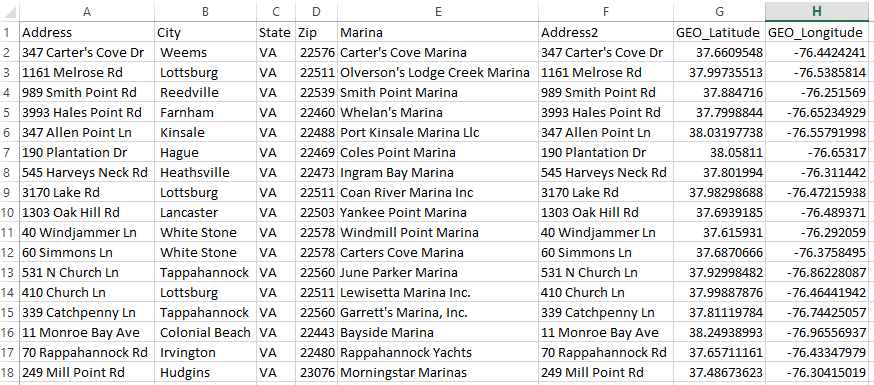
After some collection of data via Google Maps, we have a pretty simple data set – one column for Marina and another for address. We want to expand on this data set so that we have separate columns for Address, City, State and ZIP. From there, we can hit the internet.
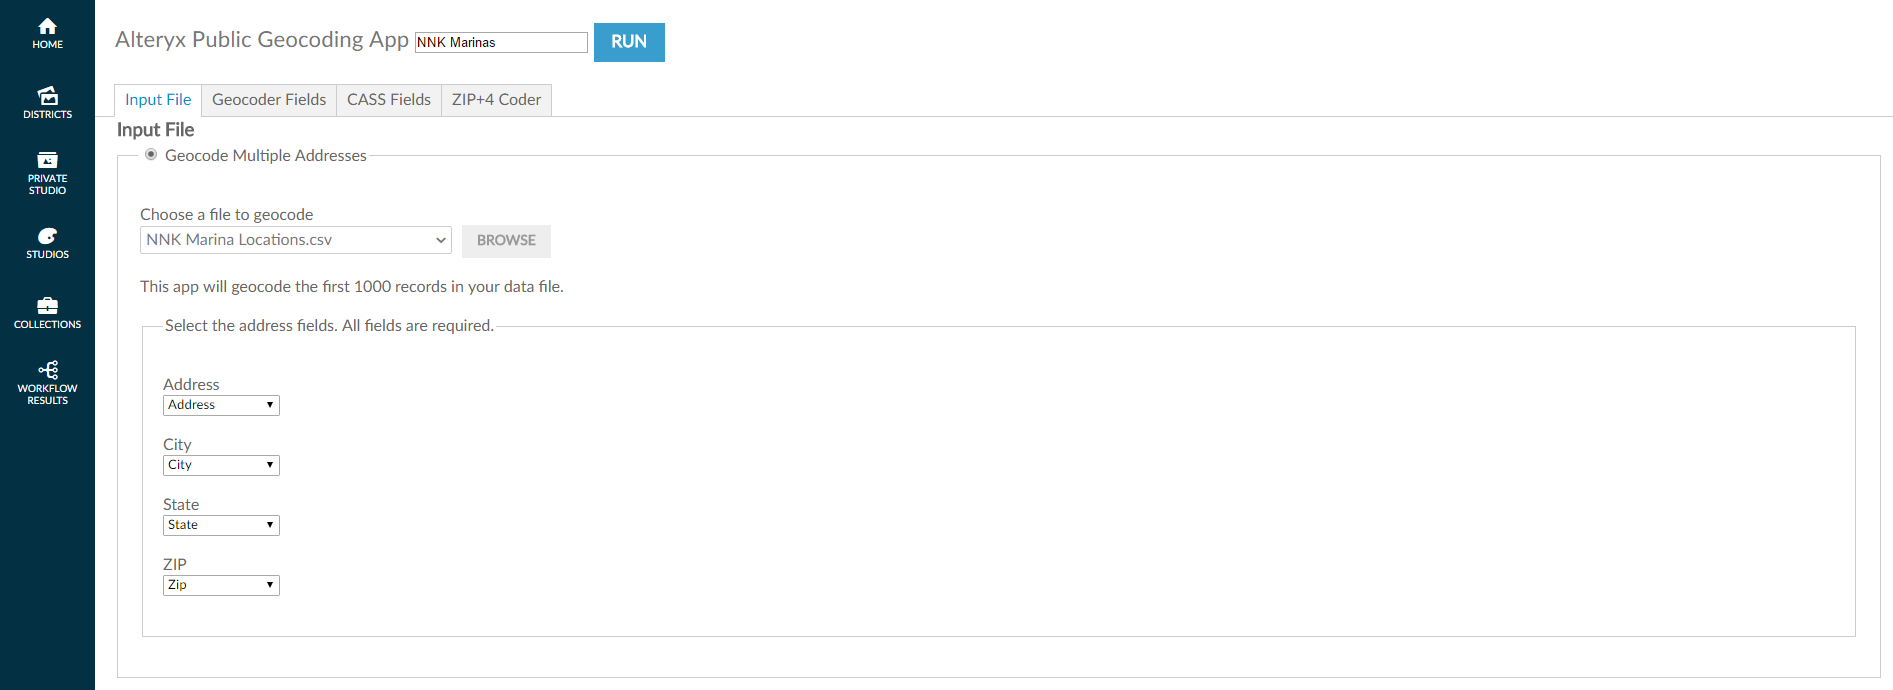
There are a number of free online geocoding applications, but for this case we’re going to use the Alteryx Public Geocoder – a free tool (requires sign up) that allows users to upload a small (1000 records or less) spreadsheet like the one I’ve created and turn addresses into latitude and longitude coordinates. All you need to do is select your data set; map your Address, City, State and ZIP fields accordingly; and select Run. Once the app finishes running, we can save to a .csv and import into Tableau:
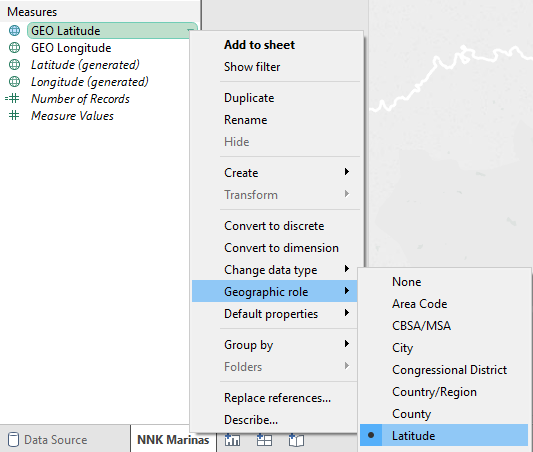
When we bring the data into Tableau, it has automatically picked a Geographic Role for our GEO Latitude & GEO Longitude fields. This is great, but remember: If our fields don’t seem to work properly, we can always right-click on the fields and assign the proper Geographic Roles:
Now, we’ll want to create our Map. Double-click on both the GEO Latitude and GEO Longitude fields to start building the map. To show each of our Marinas, I’ll drag a dimension with unique values to Detail.
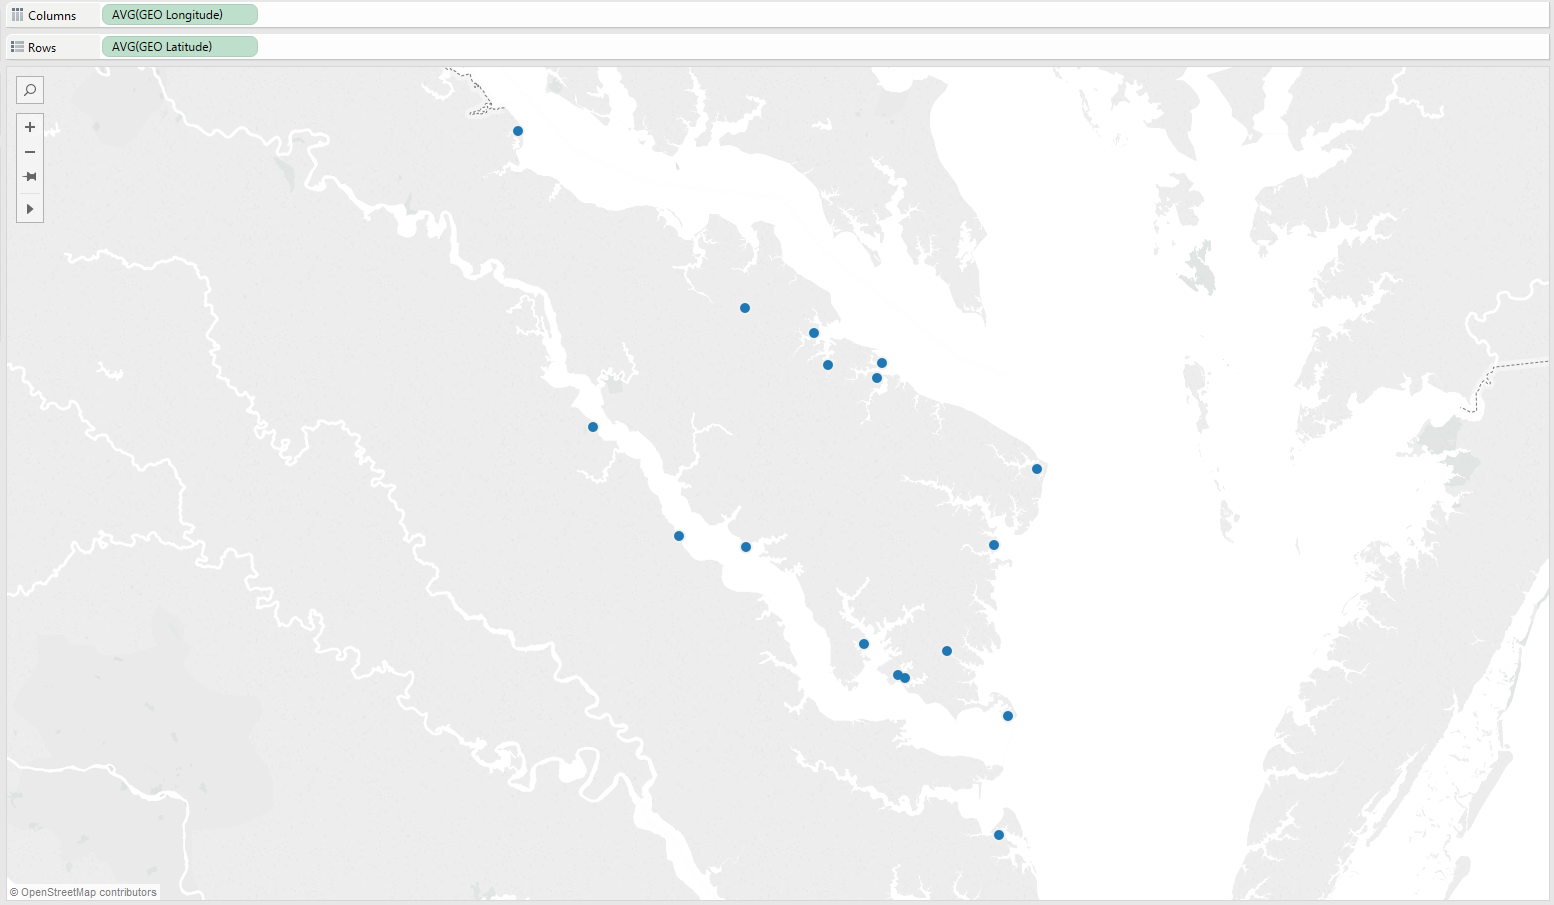
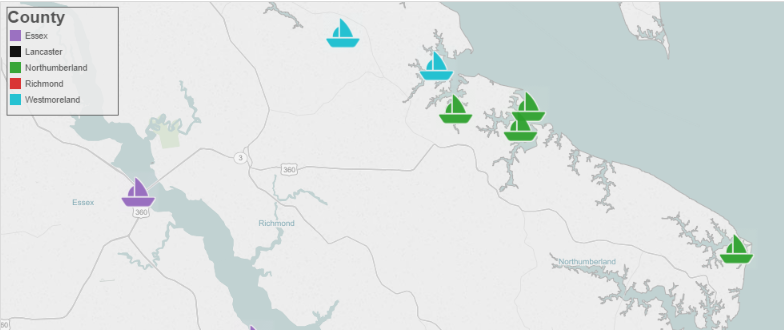
And there we have it. We’ve taken addresses in a data set and turned them into coordinates, making it possible to create this map in Tableau.
With a little bit of tweaking Tableau’s Map Layers, and by bringing in a custom shape like the boat below, we can create some fun projects using a combination of Tableau and a free geocoding tool.
Do you have any street addresses in your data? Perhaps you already have latitude and longitude coordinates? You can skip the geocoder altogether and use your data to perform a similar exercise for business practices.
The Latest
-

PYD129 – Tableau Conference History with Dan Murray
23 April, 2024