Questions from Tableau Training: How Can I Use My Current Report to Create a Viz?

Data

Questions from Tableau Training: How Can I Use My Current Report to Create a Viz?

by Chris Sanders
//

Our Certified Tableau Trainers are asked a myriad of questions each day. In this series, they share some answers.

 Often times during training, students approach me with a pretty understandable issue.

“I already build this report. How can I use my current output to build a visualization in Tableau?”

Excel report

My initial response is: “Let’s see if we can access the original data. Using the transactional database will allow for additional (and easily repeatable!) analysis.” But what if using transactional level data isn’t an option?

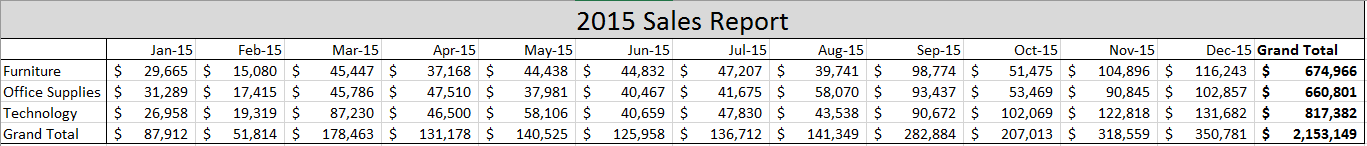
It makes sense, we have this straightforward sales report in Excel that’s readily available, and we want to continue using our current process – except our end product will now be in Tableau. However, there are a few issues. When we connect to our report, our data preview looks a little off:

Connect to report in Tableau

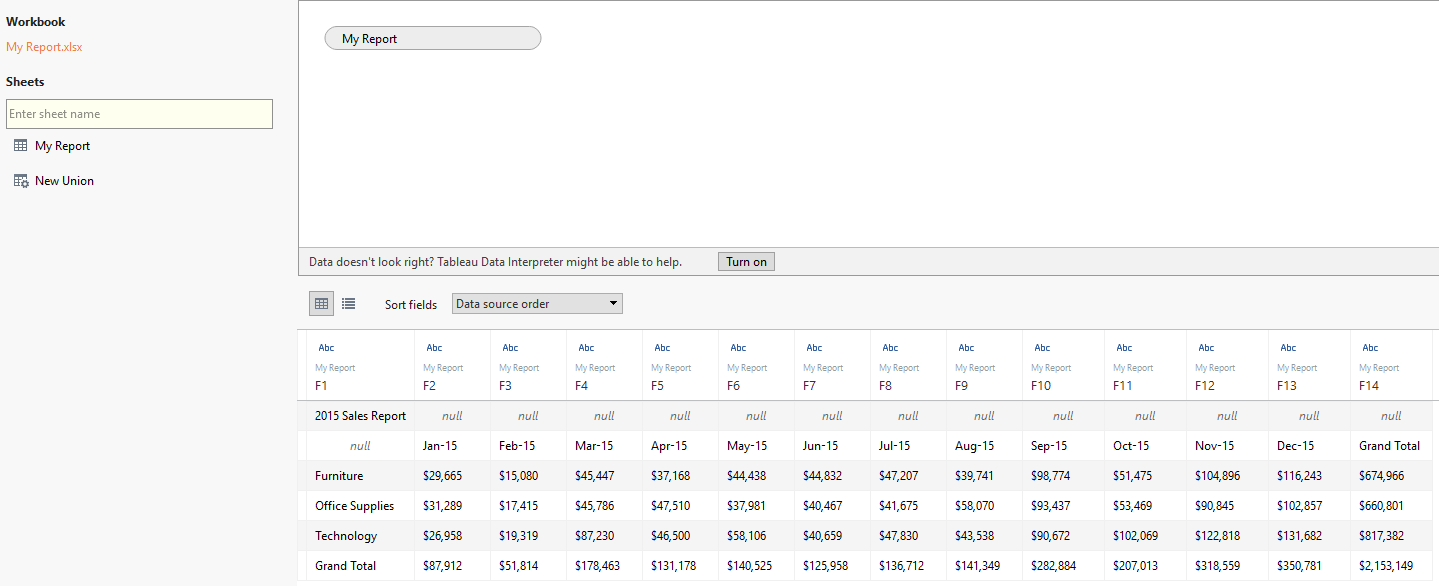
None of our columns have proper names, and we have one cell in the top left that shows us the title of our report (in this case, 2015 Sales Report). This is an easy fix through the use of the Tableau Data Interpreter.

Tableau Data Interpreter

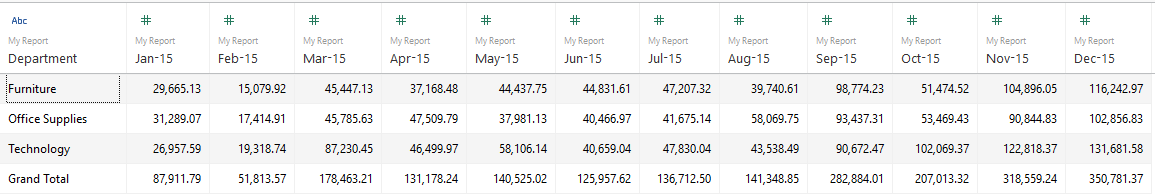
Much better. Our data is now in a more usable format than it was before. Understand that in our Department column there is a member called Grand Total. Once we begin creating our visualization, we’ll want to filter out Grand Total under Department or else it will be included in our viz (which, we don’t want). Additionally, we’ll want to hide our column called Grand Total as it’s just a summation of all of the months in our report. Remember: We can always add Grand Total to our views via the Analytics pane.

Better data!

We’ll need to take one last step before we move onto our sheet and begin creating our visualization.  Tableau works better with “tall” data as opposed to “Wide” data, so let’s use Tableau’s Pivot capability on our Monthly Sales columns so that we only have three columns in our data: Department, Month and Sales.

Tableau Pivot feature

Once pivoted, we can rename our newly created columns to Month and Sales. Now let’s move on to Sheet 1.

Before creating our viz, we’ll want to filter out Grand Total under Department. Then bring Sales to Rows and Month to Columns and change our Marks to a line. Notice how our data is currently sorted?

Beginning of the Tableau viz

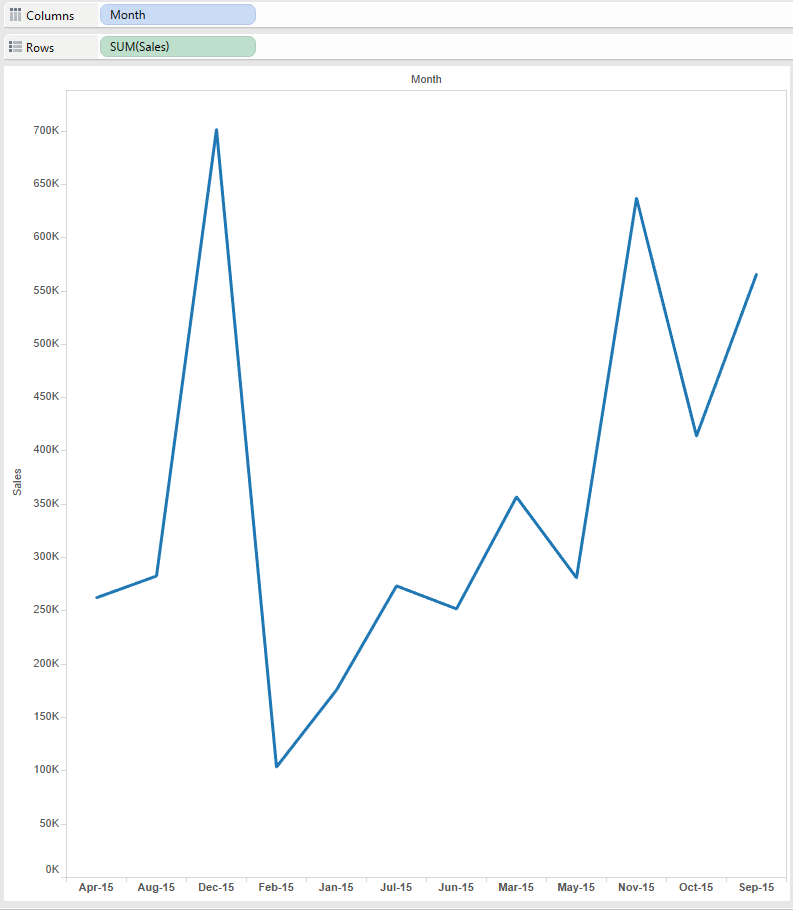
We’ll work around this by performing a manual sort. Once we’re sorted properly, we can bring Department to Color to show a time series of our monthly sales for each department.

Tableau time series!

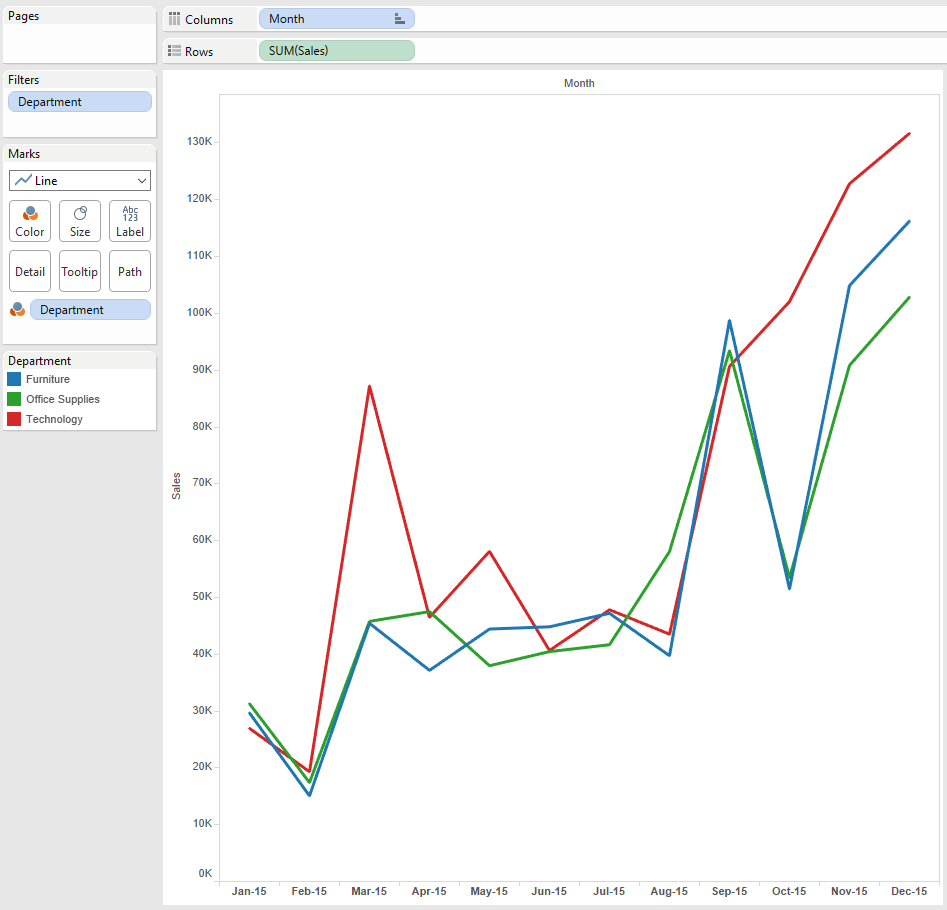
And that’s it. Ideally, we would be able to access the transactional database that originally created our sales report; but sometimes that’s not possible, and this solution works great in a pinch. 

Want More Questions from Tableau Training

  1. Questions from Tableau Training: Quick Filter Interaction
  2. Questions from Tableau Training: Labeling with Table Calculations
  3. Questions from Tableau Training: Speeding Up Presentation Views when Using Tableau
  4. Questions from Tableau Training: Dashboard Actions
  5. Questions from Tableau Training: Business Day Calculations
  6. Questions from Tableau Training: Adding Gaps Between Bars
  7. Questions from Tableau Training: When to Pivot Data in Tableau
  8. Questions from Tableau Training: Adding Conditional Formatting
  9. Questions from Tableau Training: Setting Weekday Start
  10. Questions from Tableau Training: How Do ZIP Codes Work in Tableau?
  11. Questions from Tableau Training: The Small Grey Bar Within a Quick Filter
  12. Questions from Tableau Training: Matching Mark Color
  13. Questions from Tableau Training: Showing the Null Indicator
  14. Questions from Tableau Training: Can I Manually Set the Colors of a Stepped Gradient?
  15. Questions from Tableau Training: How Can I Get Box Plot Data into a Crosstab?
  16. Questions from Tableau Training: How Do I Clear a Worksheet? Make a Copy?
  17. Questions from Tableau Training: Opening URL Actions Inside of a Dashboard
  18. Questions from Tableau Training: Can I Move Mark Labels?
  19. Questions from Tableau Training: How Can I Use My Current Report to Create a Viz?
  20. Questions from Tableau Training: Can I Create Text Hyperlinks on a Dashboard?
  21. Questions from Tableau Training: How Can I Transform My Crosstab into a Flat List?
  22. Questions from Tableau Training: Labeling the Top N
  23. Questions from Tableau Training: How Can I Customize Charts with Parameters?
  24. Questions from Tableau Training: Combining Measures into a Single Line
  25. Questions from Tableau Training: How Can I Create Custom Color Palettes?
  26. Questions from Tableau Training: Can a Top N Parameter be Nested Within Other Fields?
  27. Questions from Tableau Training: Conditional Scope on Tableau Calculations
  28. Questions from Tableau Training: Top Ten Plus N
  29. Questions from Tableau Training: Dynamic Label Positioning
  30. Questions from Tableau Training: Using Cross Joins to Solve Active Tickets
  31. Questions from Tableau Training: Top N Highlight Table
  32. Questions from Tableau Training: How to Use Specific Dimensions in Table Calculations
  33. Questions from Tableau Training: Moving Reference Line Labels
  34. Questions from Training: Comparing Metrics for Same Weekday in Previous Year
  35. Questions from Tableau Training: Colouring Specific Columns and Rows in a Crosstab
  36. Questions from Tableau Training: Creating a Custom Legend as a Sheet
  37. Questions from Tableau Training: How Can I Draw a 45-Degree Angle?
  38. Questions from Tableau Training: Down the Aggregation Rabbit Hole
  39. Questions from Tableau Training: Percent Change from Previous Period on a Map
  40. Questions from Tableau Training: Union File Names as Years
  41. Questions from Tableau Training: Conditional Coloring on Sparklines
  42. Questions from Tableau Training: Moving Column Headers to the Top of the View
  43. Questions from Tableau Training: Isolating Rank with Parameters and Calculations

More About the Author

Chris Sanders

Analytics Consultant
InterWorks Mentors the Next Generation of Analysts at Alteryx for Good Last week, Alteryx folks from all over the world donated their time in a concerted effort on behalf of Alteryx for Good. I had the ...
Gauges vs. Bullet Graphs in Tableau Quite frequently, students in training will ask “How do I make a gauge in Tableau?” While it’s possible, it’s not one of ...

See more from this author →

InterWorks uses cookies to allow us to better understand how the site is used. By continuing to use this site, you consent to this policy. Review Policy OK

×

Interworks GmbH
Ratinger Straße 9
40213 Düsseldorf
Germany
Geschäftsführer: Mel Stephenson

Kontaktaufnahme: markus@interworks.eu
Telefon: +49 (0)211 5408 5301

Amtsgericht Düsseldorf HRB 79752
UstldNr: DE 313 353 072

×

Love our blog? You should see our emails. Sign up for our newsletter!