Quantified Office is a series in which we tackle interesting methods of data collection, analysis and visualization to quantify activities at InterWorks' offices.
We live in an amazing world. Anything and everything can be monitored; usually without us even knowing. Just the other day, I installed an app on my smart phone and realized that my phone had been quietly recording my daily step count for years!
In our phones, we find countless apps that will measure anything from sleep data to heart rate. Wearable add-ons give us even more information. Soon, we have more data than we know what to do with! (Of course, for us, that is a good problem, right?)
In our homes, anything and everything can be automated, collect data and even interact with other devices. For a few dollars, anyone can purchase lights that can automatically come on when you walk into a room, a thermostat that automatically turns down the A/C when you leave the house or even a vacuum that magically cleans up after you. Appliances aren’t simple, mindless devices anymore – they are data collection robots!
A Use Case for a Motion Sensor
As you can imagine, this data trend is not ignored at InterWorks. Many of us own various gadgets and we frequently discuss random unorthodox uses. In one such scenario, a coworker (Mat Hughes) mentioned to me that he had acquired a motion sensor for which he had not found a good use case. At first, we programmed it to post random messages to our internal work forum (Slack) whenever anyone entered certain areas of the office. Next, we decided we’d hide it under another unknowing co-worker’s desk and send him “welcome” messages when he arrived at his desk. While all these ideas were funny, we hadn’t really found the perfect use case.
Finally, we found a great use for this gadget – a blog post! We decided that placing the motion sensor in the InterWorks kitchen area would provide us with an interesting set of data to visualize. Going into it though, we never would have expected the outcome. We expected some activity in the morning around the coffee pot, some more at lunch and maybe a few random blips of data throughout the day. As you can imagine, we grossly underestimated exactly how much the kitchen is used.
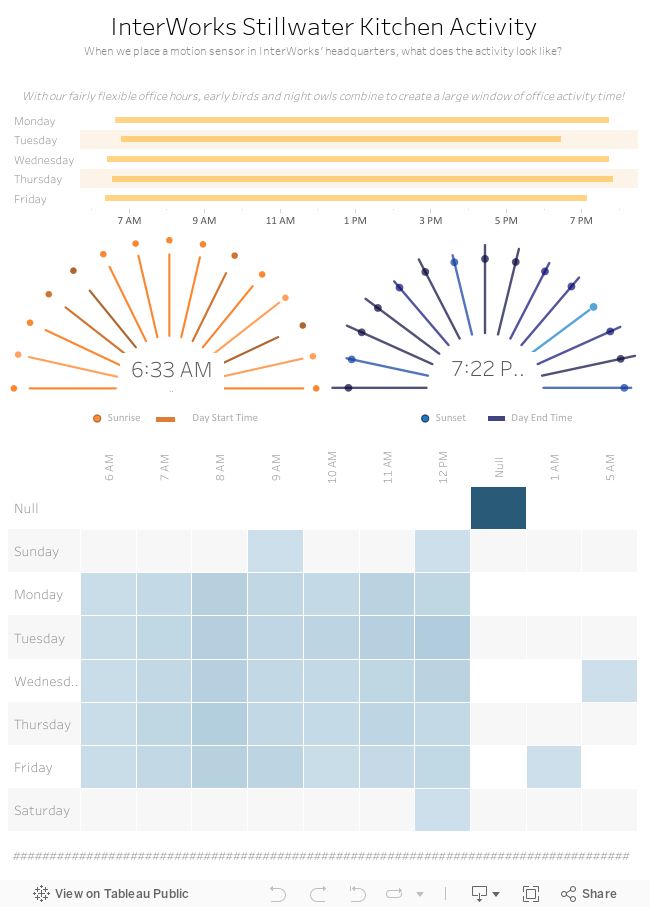
After collecting only a few days of data, it was clear we had stumbled upon a great treasure! It seems as though the kitchen is one of the first places people go in the morning and one of the last places to leave. Due to the kitchen’s central location, there is a fairly constant stream of activity throughout the day. The data shows us interesting facts we could have guessed, such as kitchen activity spikes on days when we have a potluck; but it also reveals many less known facts, such as janitorial times or the fact that we have an ambitious account manager who arrives at 6:45 every morning.
Visualizing the Data in Tableau
Playing with the data has also given us an interesting insight into InterWorks culture as a whole. We have a fairly flexible workday (within reason!), and it is clearly shown in the data. Looking at the chart below, you will see that a few people start arriving very early in the morning but some people stay late instead. The experience has really opened our eyes a bit to what exactly is happening right around us!
As insightful as this has been though, you likely don’t care to set up a motion sensor in your office space to monitor fellow employees (and I wouldn’t even recommend that), but I do hope that this helps you open your eyes to the possibilities. We live in an era where you can monitor all kinds of things in our daily lives – the only limitation is your imagination!
I hope you enjoy diving into the dashboard below to see the information we’ve gathered! In the next few days, I will be posting some follow up blog posts in this series detailing exactly how we gathered our data and built the dashboard. Keep an eye out on our blog for more!