
10 Questions is an ongoing blog series in which Tableau Zen Master Dan Murray interviews some of the brightest folks in the world of data.
After completing my first book, I enjoyed traveling all over North America and Europe speaking at companies and Tableau User Groups. A big part of the fun was meeting hundreds of Tableau users. One of the first user groups to contact me to ask if I would be willing to speak was in Paris.
The group leaders there are a couple of consultants (Damien Lesage and Geoffrey Felix). Geoffrey is still in consulting. Damien is now a BI and data visualization consultant at Criteo. Because I was spending the weekend in Paris, they both met me at a café near Notre Dame. We spent the afternoon observing Paris at a café near Shakespeare and Company, talking about data visualization.
The next day, Damien introduced me to Gaëlle Periat during the post-event mixer. Some people in this world are immediately interesting. Gaëlle is one of those people. Her intellect, personality and appearance combine to make her a magnetic personality. She loves BI, data visualization and Vincent Van Gogh. Gaëlle’s job is head of BI at Bla Bla Car. She is an avid Tableau expert.
The Questions
Q: Tell me about BlaBlaCar. When are you coming to the United States?
Periat: BlaBlaCar is the world’s largest long-distance ridesharing community. We connect people seeking to travel with drivers going the same way. They travel together and share the cost of the trip. The average journey is about 340 km (211 mi). BlaBlaCar provides its service via iPhone and Android mobile apps, mobile websites and desktop websites.
BlaBlaCar’s mission is to create an entirely new, people-powered network with a trusted community of drivers and passengers. Collectively, we are building a more efficient and more social form of transport based on the optimization of empty seats in cars. We call it people-powered travel and want to make it the first choice of every traveler.
We would be keen to launch in the U.S., but it is a difficult market to tackle for long-distance ridesharing as the financial incentive to rideshare is less impactful given the low costs of gas compared to Europe. Moreover, the distances are huge, and there is an issue of finding meeting points for ridesharers to meet in big cities such as LA where people can live one hour from another. For those reasons, launching BlaBlaCar in the U.S. is not on our roadmap on a short term.
Q: Most people in the United States are not familiar with BlaBlaCar. How is BlaBla ridesharing different from services that people in North America are more familiar with, like Uber or Lyft?
Periat:
- Drivers conduct a personal trip (non-commercial): BlaBlaCar is designed for drivers already planning a personal journey who wish to share their empty seats with passengers heading the same way. This makes their long journey more cost-efficient and enjoyable. In contrast, drivers on taxi-like apps respond to the demand of a client who decides the destination (the driver sells a service).
- Long-distance journeys: BlaBlaCar provides a shared transport solution for city-to-city journeys whereas taxi-like transport apps focus on short urban trips.
- Drivers don’t earn a profit: BlaBlaCar members share the costs of a journey and do not make a profit. Drivers of taxi-like apps earn a revenue for the trip.
Q: As Business Intelligence Manager at Bla Bla Car what is the scope of your responsibilities?
Periat: My team and I are responsible for determining user needs, building a strong and scalable platform, collecting data, providinginformation, and then building and sharing reports.
I did some data evangelism at the beginning, but now everyone at BlaBlaCar is interested in data.Every decision is made with data. As I introduced Tableau in BlaBlaCar, I’m the referent for questions. To answer questions, I found some good books like yours!
Q: When did you first discover Tableau Software and how did you first use it?
Periat: I discovered Tableau on my previous job at IsCool Entertainment in 2010. I was in charge of Social Games Analytics. I remember being told, “This is Tableau. It will be your best friend. Enjoy!”
So, I connected Tableau to my database, and I was able to do something useful in less than five minutes! I was so enthusiastic to be able provide a great report to my internal customers so quickly!
Q: You are very involved in the Paris Tableau User Group. Why?
Periat: I’m convinced of the value of learning-sharing. When I began to work with Tableau, I was very happy to find that the Tableau community helped me solve complex vizualization challenges. So, it’s normal for me to do the same thing now that I have some experience with Tableau. One day, someone helped me, so today, I help someone. It’s my conception of Life. 🙂
Q: How has Tableau helped the management team make better decisions at BlaBlaCar?
Periat: Tableau help us to automate reports. Before Tableau, we got csv files every month and data analyst should aggregate all information in one file before sharing. Now, we have daily, weekly and monthly reports with more information which are also automatically refreshed and viewed by everyone, everywhere in our company (India, Russia, France, etc.).
Q: What do you see happening in the world of “Big Data” over the next five years?
Periat:
- I hope we stop to say “Big Data” for all and nothing!
- We need to see more real use cases. Today, everyone talks about Big Data but a very low number of people seem to be using it in production.
- Real analytics with Cassandra and Spark, for example.
- More predictive analytics.
- More collected data with the internet of things.
Q: How do you see Data Visualization enhancing data over the next five years?
Periat:
- A lot of interactive data viz (with tactile screen). It shouldn’t just be a dashboard or a data visualization; it will be data story. And how do we tell a meaningful story without great images?
- No more Excel spreadsheets.
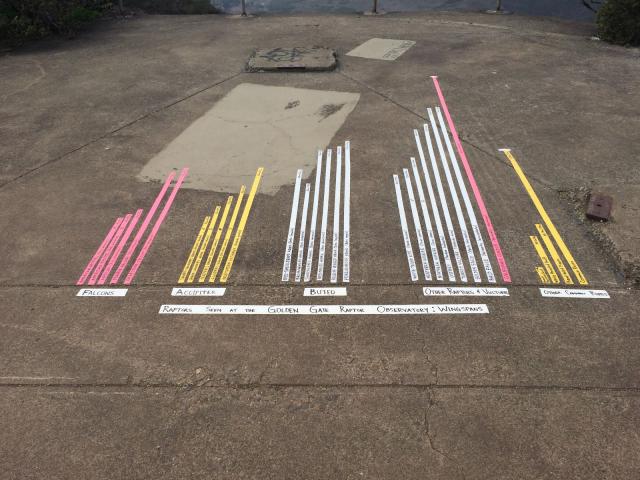
- More real data viz for more Poetry & Colours in life. When I went to San Francisco last summer, I saw a real data visualization near the Golden Gate Bridge that showed the number of birds by type, and I was so surprised! I’d like to see more of this.
Q: What do you hope to see Tableau Software do with the Desktop and Server products in future releases?
Periat:
- Easier joins between different data sources with the VizSQL interface.
- Activating alerts when problems happen on Tableau Server or if a measure is out of a defined range of values.
- Possibility to kill some processes in the Tableau Server interface.
- A great Mac version for Tableau Desktop that doesn’t crash on OS X Yosemite! I’ve had 3 crashes today while I was creating some maps.
- Dynamic parameters.
- A Linux version for Tableau Server to make my sys admin happy.
Q: Why are you in love with Vincent Van Gogh?
Periat: I’ve loved Vincent since I was child. I’m a little freak about colors! I love them (my iPhone apps are sorted by color) and the paintings of Vincent are so colorful. I fell in love with his paintings first, and after that, the myth about the man. I’m deeply touched by the sensibility I found in his paintings and letters to his family. I remember the first time I went to the Van Gogh Museum in Amsterdam … the thrill!
Discover More Interviews
Want to read more insightful interviews like this one? Then you’ll love our 10 Questions blog series. Check out the full list of interviews here, and stay tuned for new additions.
Need Help? Let Us Know!
There you have it. If you need help with your data infrastructure or Tableau, we have the experience, skill, and knowledge to insure your success. Contact us today to learn more.
If you’re in college and think you might want to get into this game, head to our Careers page and apply for one of our open jobs. We’d love to hear from you.