10 Questions is an ongoing blog series in which Tableau Zen Master Dan Murray interviews some of the brightest folks in the world of data.
Ryan Sleeper is a consultant based in Kansas City with a keen interest in professional sports, an infectiously positive attitude and a friendly nature. I first noticed Ryan because of his fine sports-related data visualizations and his winning performance in the 2013 Iron Viz competition.
When I did my book tour last year, I made a point to contact him about speaking at the Kansas City TUG as an excuse to get to know him better. Like many people that are passionate about data visualization with Tableau, he is a generous and active member of the user community.
The Questions
Q: How did you first learn about Tableau?
Sleeper: My first job out of graduate school in 2009 was at a small digital marketing agency in San Francisco. One day, our owner walked in and told three out of our four employees that they wanted us to try to convert some of our existing client reports from Excel to Tableau – an effort I was thrilled to take on.
I’ll admit that the self-learning curve did not come without frustrations, but I sensed Tableau was the future of data visualization, and I stuck with it. That choice to pursue expertise in Tableau has had a bigger impact on my career than anything else.
When I moved back home to Kansas City, I realized that we were behind the coasts in terms of Tableau adoption, which led to opportunities to evangelize the product and the value of data visualization in general.
Q: You have a lot of sports dashboards on Tableau Public. Why?
Sleeper: My education is from the DeVos Sport Business Management program at the University of Central Florida. Graduating during the recession in 2009, I made a conscious decision to gain some work experience outside of sports but missed being involved with the business of sports.
Tableau Public provided a fun way for me to feel involved with sports, answer some of my own questions I have been curious about and also get better at using Tableau. Ironically, getting good at Tableau has actually brought some sports business projects back to me, such as analyzing the relationship between Dr. Pepper and college football as well as data visualization consulting with the Atlanta Hawks of the NBA.
Q: Which visualization or dashboard are you most proud of and why?
Sleeper: I find great personal satisfaction whenever one of my dashboards can elicit an emotional response. I think the entire point of data visualization is to leverage visualization to communicate data in a way that provokes action. In business, that means making changes that lead to more revenue. On Tableau Public, it means hitting a personal or social nerve. Some of my favorite examples include:
- Your Salary vs. a MLB Player’s Salary, which led to dozens of tweets with people expressing their depression.
- What Are the Odds of Going Pro in Sports?, which helped educate sports parents on the long odds of their children advancing from high school to the pro level.
- KC Royals Win % vs. Home Attendance, which was featured in the Kansas City Star and caused people on Facebook to accuse the biggest Royals fan of all time of being a terrible fan … My wife enjoyed bringing that to my attention.
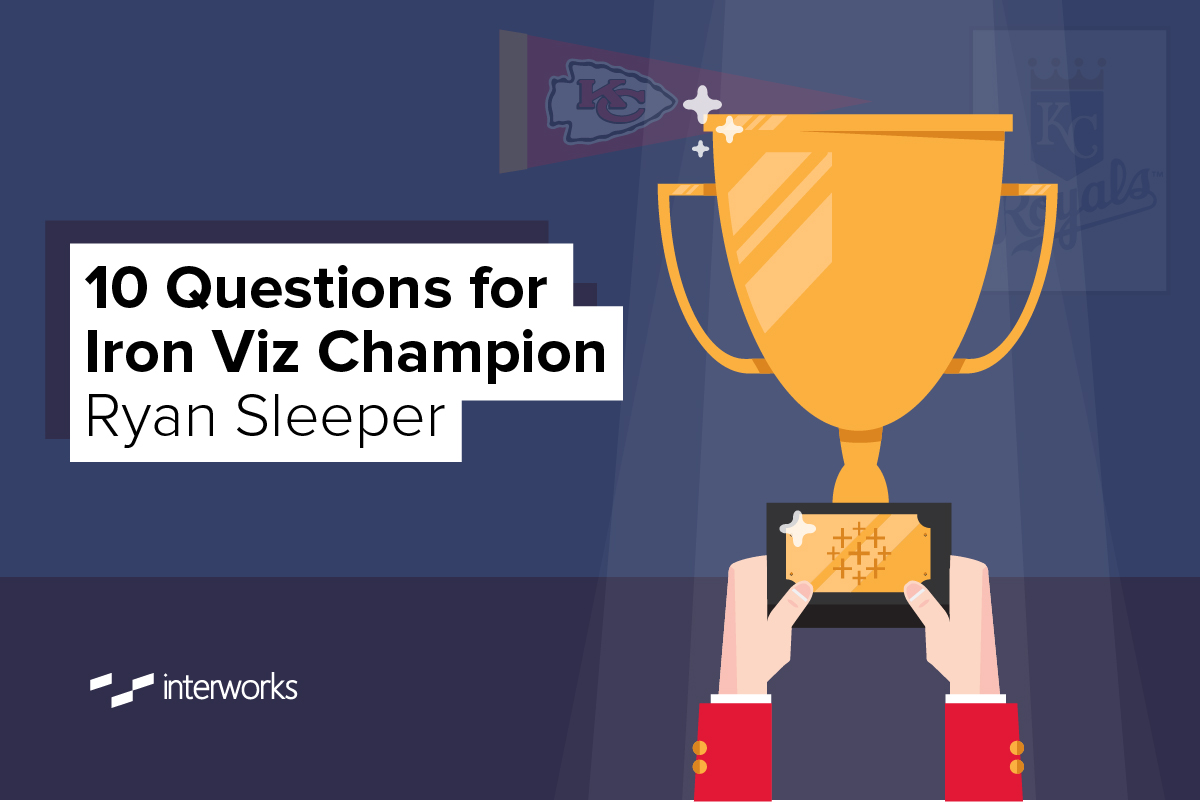
Q: You won the Iron Viz contest at the annual conference. How has that changed things personally and professionally?
Sleeper: The Iron Viz definitely accelerated my credibility and has opened several doors for me. For example, I’m not sure anybody would be reading this if I didn’t win that contest.
It also challenged me personally to keep improving because I feel I won that contest a year or two early. I’m proud of the storytelling elements I implemented at that time, but still had (and have) a lot to learn. I feel I am just now hitting my stride in terms of the full package – storytelling, design, data quality and technical expertise.
Q: What is your involvement at the Kansas City Tableau User Group?
Sleeper: I founded the Kansas City TUG in Dec. of 2013 as a way to give back to my hometown’s business community. It is free for our users, and we welcome Tableau users of any experience level to network and learn from some of the best users in the country.
My primary involvement includes securing a venue, coordinating guest speakers or filling in as needed, and facilitating each meeting. We meet on a quarterly basis and have grown our attendance to 100 as of our Q1 2015 meeting.
Thank you again for making it a point to stop in Kansas City during your 2014 book tour. That was one of the best presentations we have heard, and “Tableau Your Data!” is a must-read resource for new Tableau users.
Q: How do you decide what you post on Tableau Public?
Sleeper: Normally, my Tableau Public work is the answer to my own questions. I have a passion for sports, which fortunately provides a wealth of rich data. I’m fascinated with the history of leagues, including MLB, NFL, NBA and MLS (sorry,NHL – I never fell in love with a team growing up).
I may be curious about a topic or stumble upon an interesting data set on a Tuesday or Wednesday, think about an approach to visualize the topic for a couple of days and then build the vision out over the weekend. It’s good practice for me in both Tableau and design. If I think others would be interested in the answers the visualization provides, I publish to Tableau Public.
Q: Do you try to promote your Tableau Public material? If so, how do you do that?
Sleeper: I do try to market my content. While I create visualizations to answer my own questions, I believe another goal of data visualization should be to engage as many people as possible so that the visualization makes an impact.
All of my marketing tactics are no-cost, which began with my personal blog in 2010. I never intended to monetize the site, and I also had no money to promote my material, so I had to be creative in order to be found. My background is in online marketing, and that experience has served me very well in marketing my Tableau Public content.
Beyond posting new visualizations on LinkedIn and Twitter, I am very focused on Search Engine Optimization and have a few sites I submit each piece to, including visual.ly and reddit.com/r/dataisbeautiful. Every once in a while, I will have a breakthrough, and a larger site such as Digg.com will pick up the visualization, which helps it go viral.
I think I should provide a PSA that extremely good data visualizations will not necessarily be a viral success. I’ve personally spent days on vizzes that are very strong from a technical and analytical perspective, but they flopped.
On the other hand, my most popular viz was thrown together in about two hours. I have seen phenomenal work done by the Tableau Public community, and I am sometimes shocked to see they have only garnered one or two hundred views.
When I’m answering my own questions through data visualization, I never know what will be popular and what won’t. I think the most successful vizzes have a mix of good data, quality, design, simplicity, understandability, interesting topics and, last – but possibly most important – luck.
Q: How do you balance data and design in your dashboards?
Sleeper: If I had to narrow this answer down to one thing, I would say by paying attention to detail. This is also the easiest way for anyone to improve the design of their data visualization, even if they don’t have experience with design.
I have talked to many people that are intimidated by design and think they can’t improve that aspect of their data visualization, and I just don’t buy it. Tiny changes to the marks, lines, borders, colors and layout are the difference between a Tableau dashboard looking cookie-cutter and looking professionally polished.
Q: Who have been your biggest influencers or sources for learning?
Sleeper: I’m always amazed at how selfless the Tableau community is, and there are too many individuals to name. I admire all of the Tableau Zen Masters and others in the community forums that take the time to answer specific questions for nothing in return. For example, Ramon Martinez has done a phenomenal job of aggregating some of the best Tableau material here.
If I had to choose one person that has had the biggest influence on my data visualization style and even my career, it would be Ben Jones of Tableau and dataremixed.com. I followed Ben’s work at his personal site before seeing him present at the Tableau Conference in 2012. We share a passion for sports
The Latest
-
Kickstarting Data Innovation in Healthcare
18 April, 2024