They Ate the Whole Thing(s): Visualizing Nathan’s Hotdog Eating Championship in Tableau

Data

They Ate the Whole Thing(s): Visualizing Nathan’s Hotdog Eating Championship in Tableau

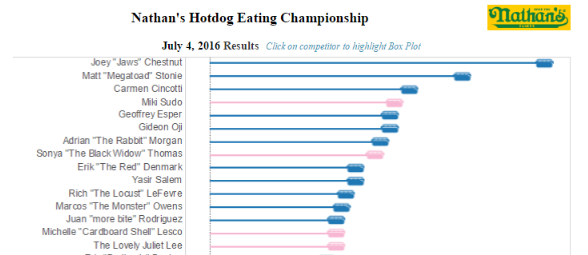
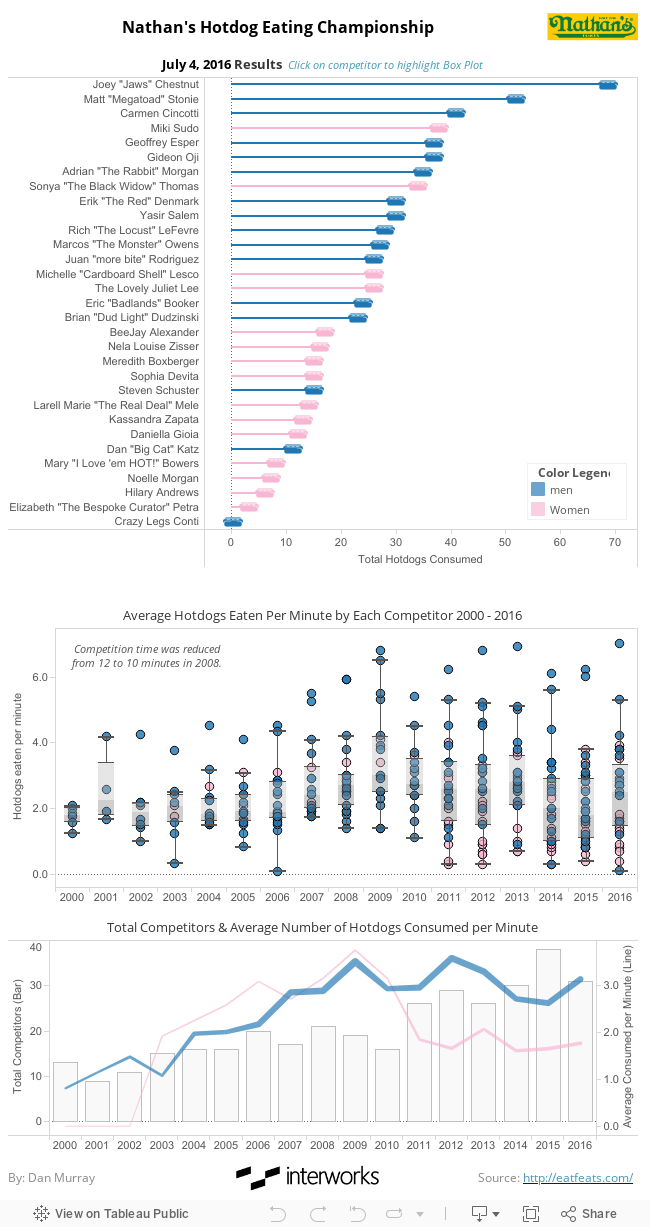
Yesterday, Nathan’s had their annual hotdog eating championship in Coney Island, New York. The men’s winner was the dominant Joey Chestnut who consumed 70 hotdogs in 10 minutes. Ladies winner Miki Sudo ate 39 hotdogs. Ouch! I think that I’d need more than one antacid after that kind of self-abuse. Thanks to FiveThirtyEight for their inspirational post, which led me to visualize the competition in Tableau:

More About the Author

Dan Murray

Director of Strategic Innovations
Ten Questions for ChatGPT about Tableau and Level of Detail Expressions I had some fun with ChatGPT asking it questions about cohort analysis this week. I’ll spare you the 4,000 words it created on general ...
The BI Cantos: Facilitating Data Culture Environments that encourage learning, sharing and discovery will prosper. Environments that don’t will not achieve high ...

See more from this author →

InterWorks uses cookies to allow us to better understand how the site is used. By continuing to use this site, you consent to this policy. Review Policy OK

×

Interworks GmbH
Ratinger Straße 9
40213 Düsseldorf
Germany
Geschäftsführer: Mel Stephenson

Kontaktaufnahme: markus@interworks.eu
Telefon: +49 (0)211 5408 5301

Amtsgericht Düsseldorf HRB 79752
UstldNr: DE 313 353 072

×

Love our blog? You should see our emails. Sign up for our newsletter!