Outrage and Apathy: Presidential Election Voter Participation Visualized in Tableau

Data

Outrage and Apathy: Presidential Election Voter Participation Visualized in Tableau

Emotions are running high right now as evidenced by the large number of people participating in the Women’s Protest Marches all over the world this past weekend. My oldest daughter is 24 years old. She wasn’t happy with the outcome of the election, but she didn’t vote. This and a Seth Godin post I read this morning got me interested in digging a little deeper into voter participation, specifically by state. 

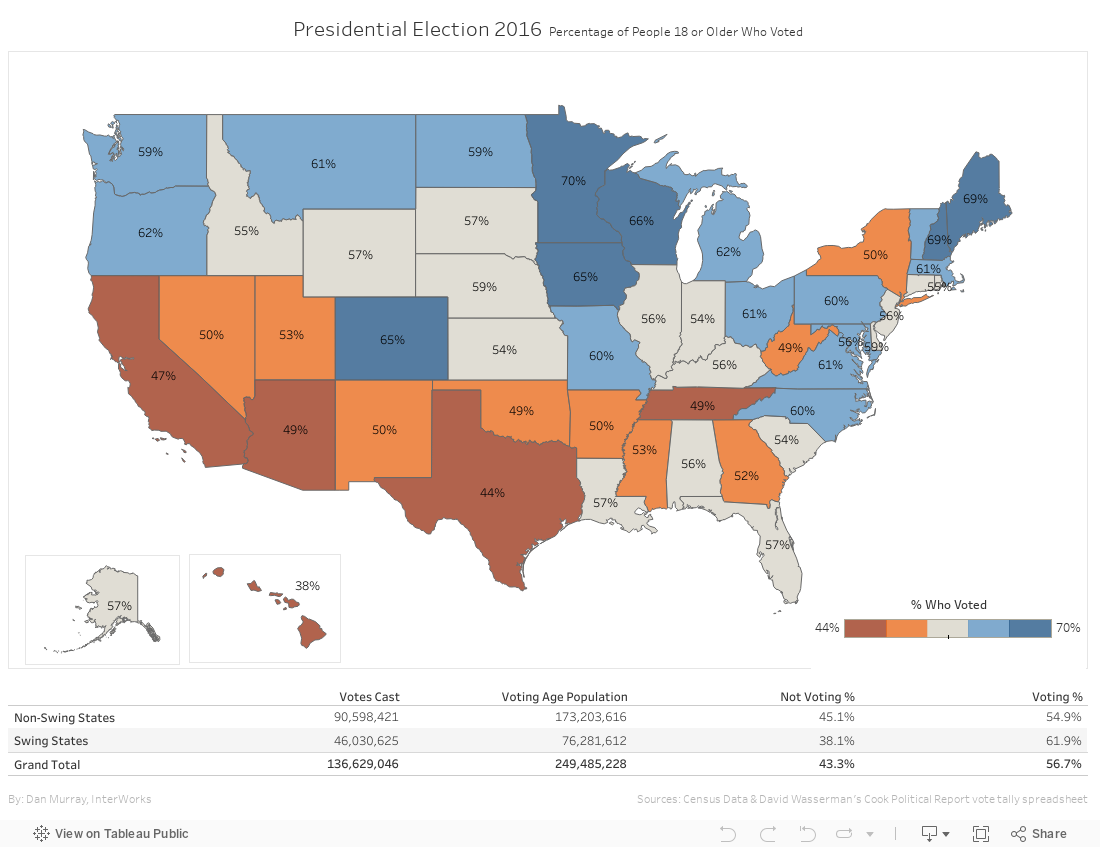
Using the Cook Political Report voting spreadsheet by David Wassermen, I combined that with Census data for people 18 or older by state. I found that over 100 million of the 249 million people of voting age in the United States didn’t vote in this election. If you don’t exercise your right to vote, then you allow other people to decide. Perhaps this election will energize the non-voters in the next election cycle.

More About the Author

Dan Murray

Director of Strategic Innovations
Ten Questions for ChatGPT about Tableau and Level of Detail Expressions I had some fun with ChatGPT asking it questions about cohort analysis this week. I’ll spare you the 4,000 words it created on general ...
The BI Cantos: Facilitating Data Culture Environments that encourage learning, sharing and discovery will prosper. Environments that don’t will not achieve high ...

See more from this author →

InterWorks uses cookies to allow us to better understand how the site is used. By continuing to use this site, you consent to this policy. Review Policy OK

×

Interworks GmbH
Ratinger Straße 9
40213 Düsseldorf
Germany
Geschäftsführer: Mel Stephenson

Kontaktaufnahme: markus@interworks.eu
Telefon: +49 (0)211 5408 5301

Amtsgericht Düsseldorf HRB 79752
UstldNr: DE 313 353 072

×

Love our blog? You should see our emails. Sign up for our newsletter!