
As a basketball fan, there are few places with a more unique history and culture than New York City. Since the sport’s early days, NYC has been a breeding ground for some of the best talent on earth to cut their teeth on playgrounds and parks throughout the city. I’ve lived in New York for the past five-plus years, and as a casual basketball player myself, my very favorite thing to do is explore different neighborhoods by immersing myself in pickup games on courts around the city. For me, what makes NYC so unique is the character and personality each neighborhood takes on, and that diversity shines through in the style of play and type of personas seen on the streetball courts.
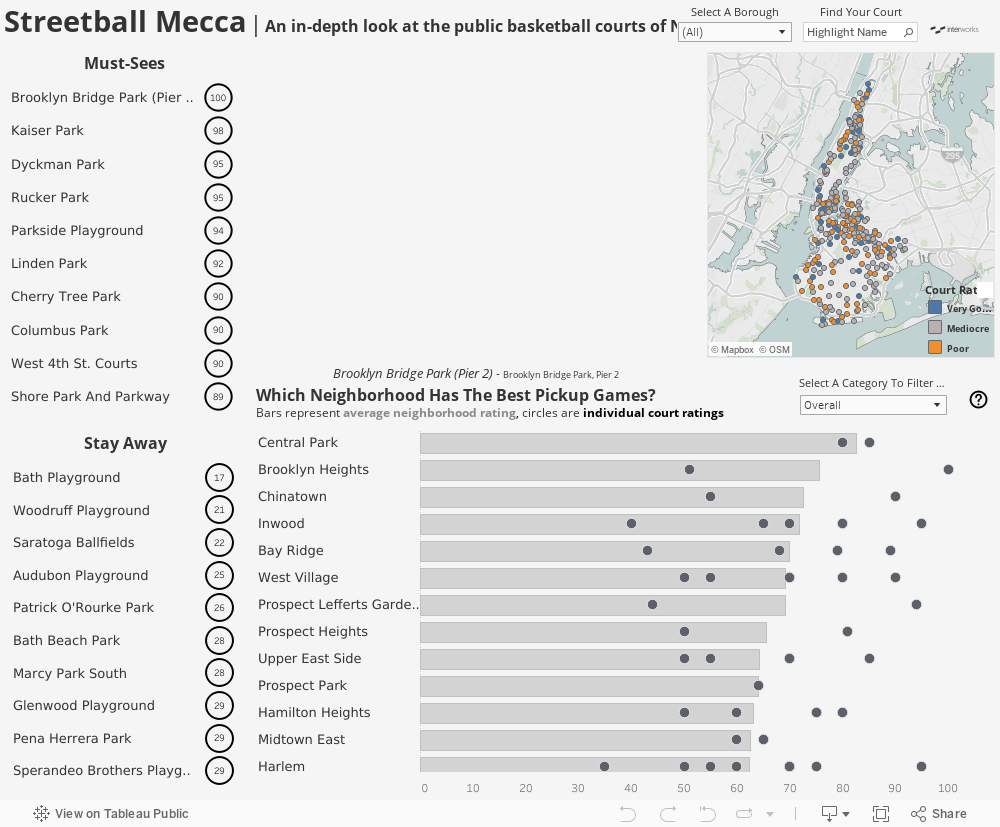
So, when I found an article from “The Wall Street Journal” about a comprehensive ranking of every public basketball court in Manhattan (and another one for Brooklyn two years later), I knew I wanted to convert the data into an interactive visualization. This viz would not only show off the work the authors had done, it would also delve further into the exploration of the data at a neighborhood level in addition to the individual courts. After receiving permission from the authors to extrapolate on their article, I began building out the viz in Tableau.
Shaping The Data
While the data provided from the authors of the WSJ article was very solid, it needed a little bit of prep work to bring into Tableau. First, since the data was actually coming from two separate articles, I needed to normalize them so that they could be used together. The Manhattan courts were scored on a system that ranked four categories on a scale of 1-5, while the Brooklyn article altered the scoring system to a 1-25 scale. So, to standardize the numbers, the Manhattan scores were multiplied by 5 across the board. Next, I unioned the two disparate data sets from each of the boroughs together and adjusted for the differences in the categorical naming conventions to create one data source. The final data prep problem, however, took a little bit more time to get working in a proper manner.
Dynamic Image Filters in Tableau
To get a picture of each of the courts to show dynamically in the viz turned out to be a bit more work than anticipated. I first had to compile and locally save the pictures, which was made a lot easier due to the fact that the Brooklyn court pictures could be taken directly from the source. The Manhattan court pictures, however, no longer exist online due to an unforeseen technical glitch on the WSJ website. To remedy this, I used publicly available pictures online from the NYC Parks Department. Because the pictures were of varying sizes, though, I needed to make use of a free image resizing tool on birme.net to help transform the batch of images into similar formats.
Once I had all 306 pictures resized, I decided that using a web object in Tableau would be a more efficient way to display them rather than converting each court into an icon to house within the workbook. But, before I could properly use the web object, I needed my resized pictures to each have their own custom URL. So, I used FileStack.com’s Image Transformation tool to accomplish this by uploading each picture, giving it a custom size, and allowing Filestack to assign a custom URL to the image. I then added the URL as a column in the unioned Excel file that contained the rest of my data.
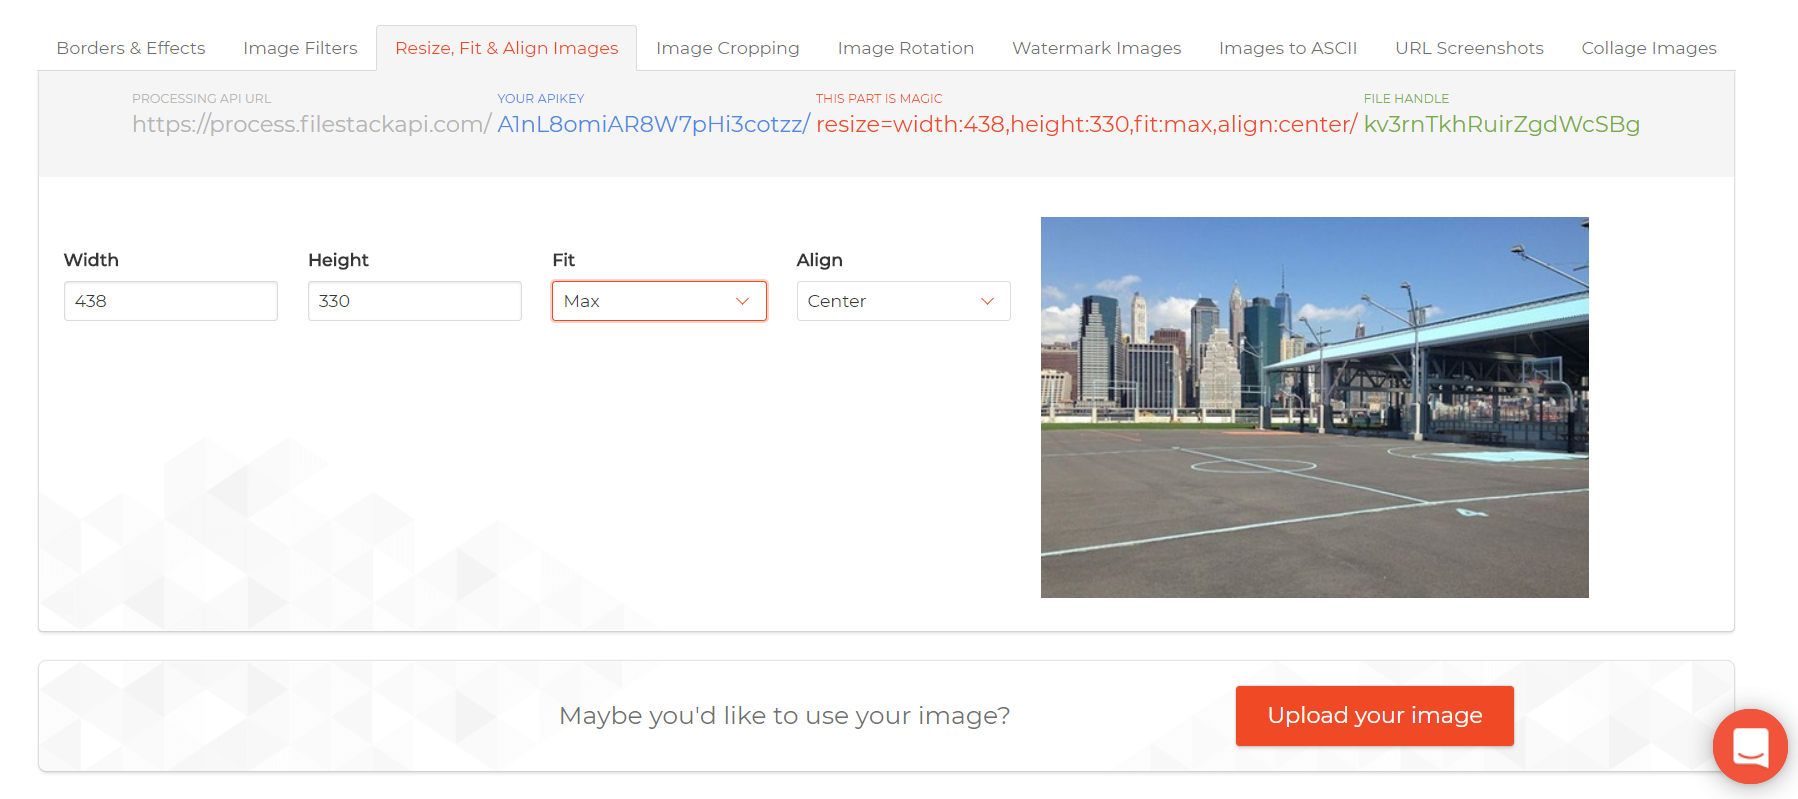
Above: The FileStack Image Transformation Tool.
Assigning a URL Action to a Web Object in Tableau
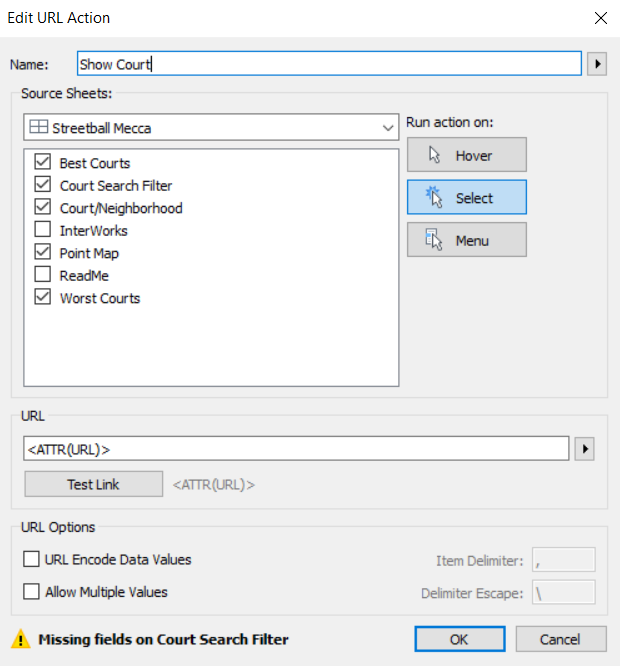
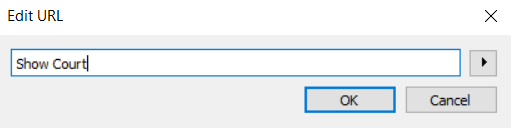
To finally get the images to show dynamically in my viz, the web object I created would have to interact with the other worksheets on the dashboard. So, I first created a URL action called Show Court that referenced the URL column in my Excel file that contained all of the custom URL’s created using FileStack.
Finally, to get the URL action to work as I planned, when I brought on the web object, I simply called out the name of the URL action in lieu of a true URL. Tableau took care of the rest. While the process involved a number of steps to get to the final product, using the court URLs via the web object allowed me to dramatically improve the performance of the visualization compared with an effort to have 306 images as icons saved within the workbook.
 >
> 
Overall, the viz turned out exactly as I had envisioned, thanks mostly to the data collection efforts of Stu Woo and Jonathan Clegg. As a fan of the sport, I hope that the viz can act as a resource for other NYC basketball fans to use pickup streetball as a vessel to explore the city. With only Brooklyn and Manhattan included in this viz, maybe an enterprising individual will be energized to take it upon themselves to finish off the city by collecting data for the courts in the remaining NYC boroughs of the Bronx, Staten Island and Queens.