
Greetings from Washington, D.C.! Here in the district, some of the hottest concerns for the city revolve around our population growth, shifting demographics and economic well-being. I downloaded 2010 Census data in D.C. to take a look across population, economic and housing data across all D.C. zip codes. Using Tableau 10’s new custom territories feature, I can now combine geographic areas into custom groupings – and better yet, I can aggregate and analyze my data based on these groupings.
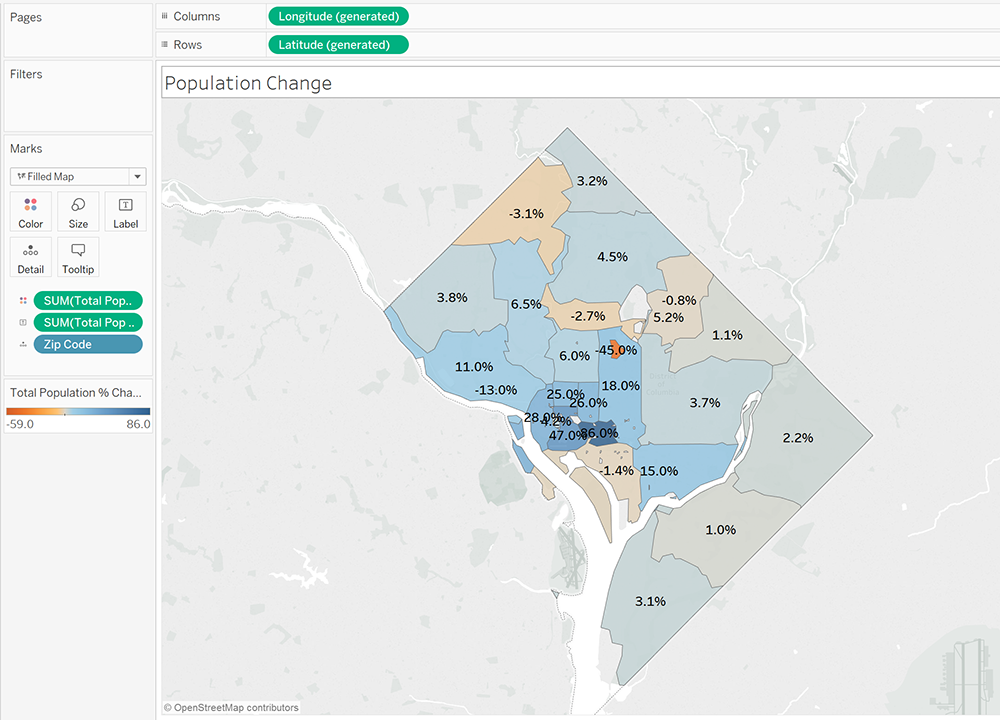
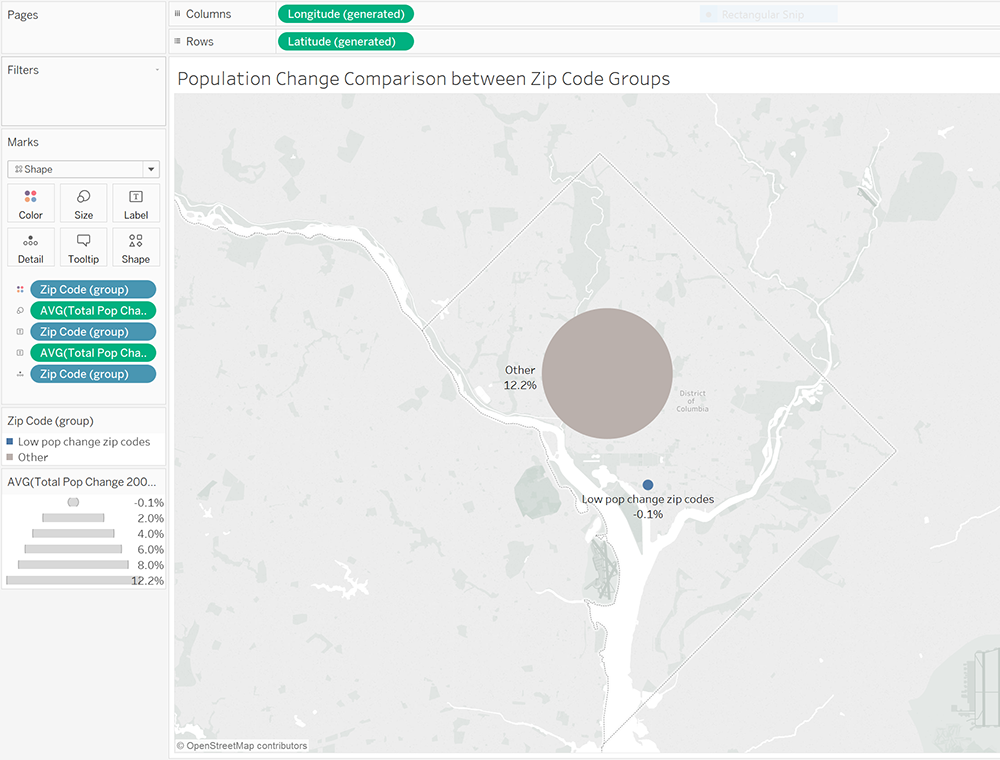
You can see the percentage change in population for each D.C. zip code, from 2000-2010:
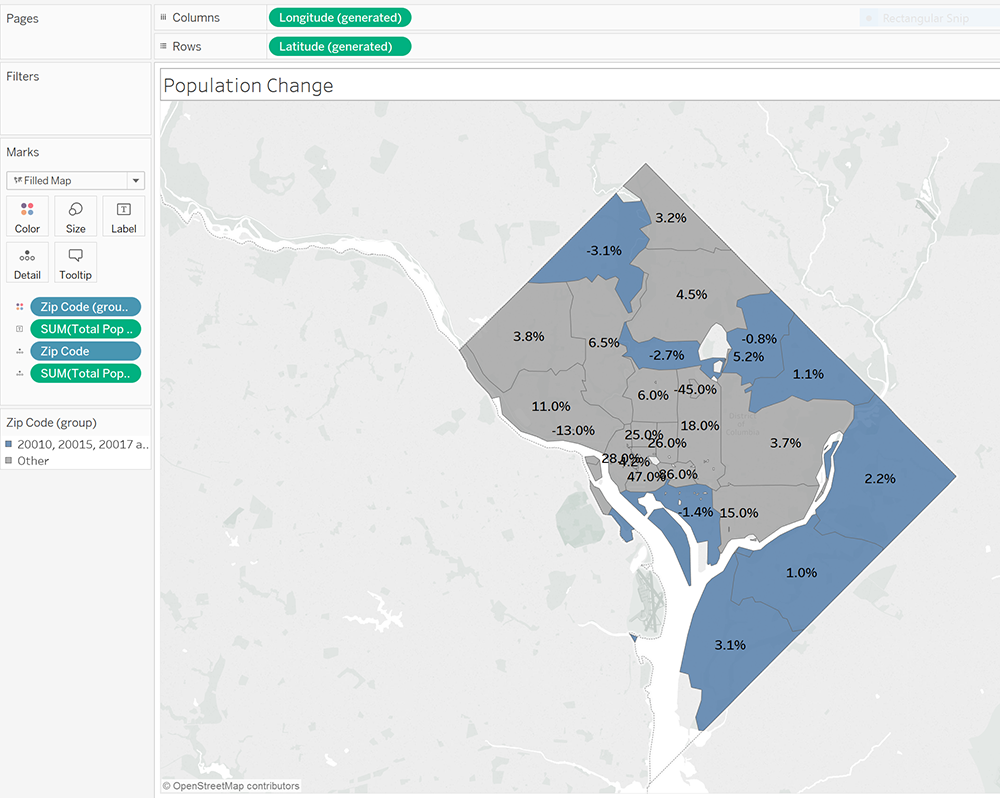
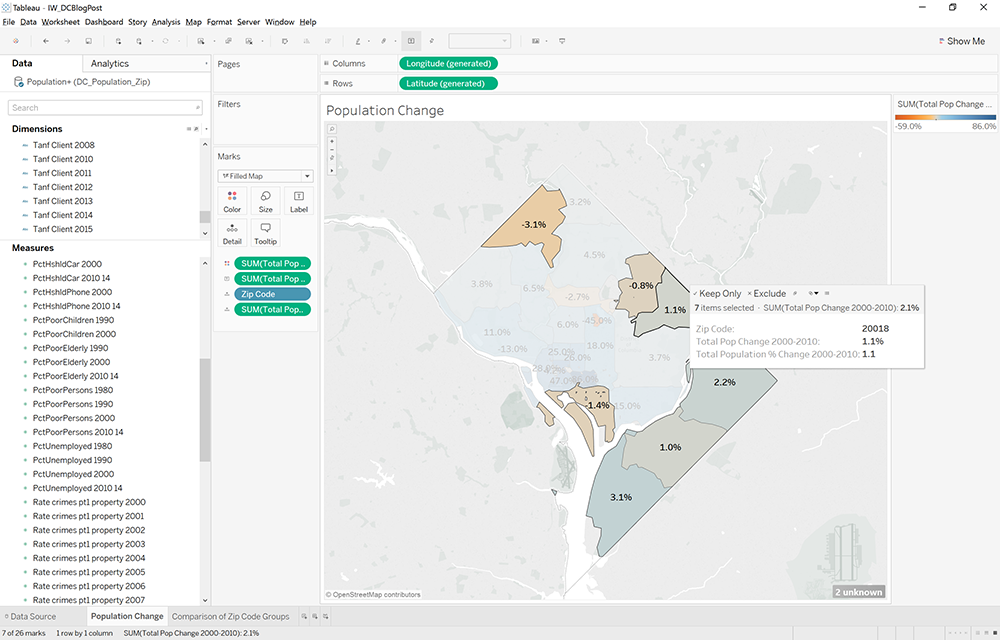
With several zip codes that have very low or negative population growth, I was curious to see how these zip codes performed on other census data. Using Tableau’s new custom territories, I can select those zip codes in my map and aggregate data based on those territories:
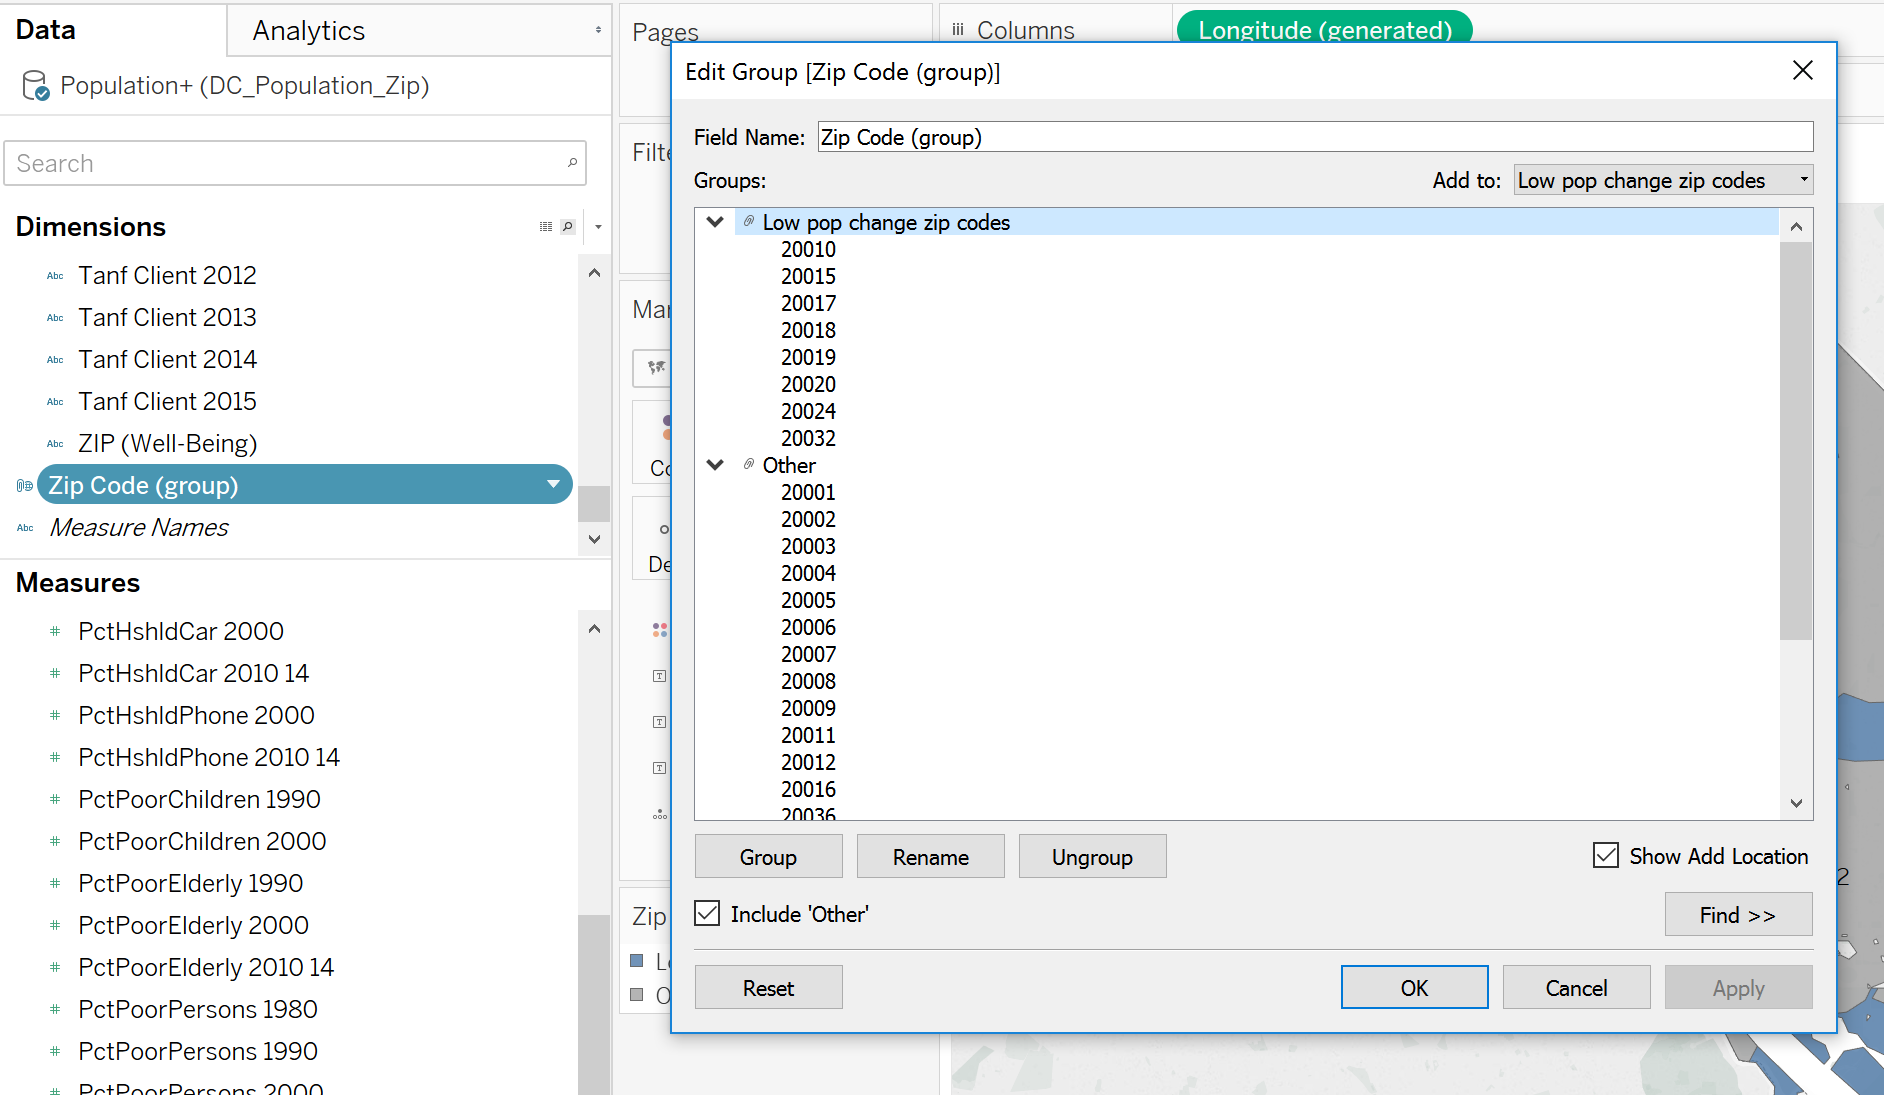
Creating custom territories is similar to how we can create visual groups within Tableau. Tableau will create a new field where you can organize other areas into territories and re-name them:
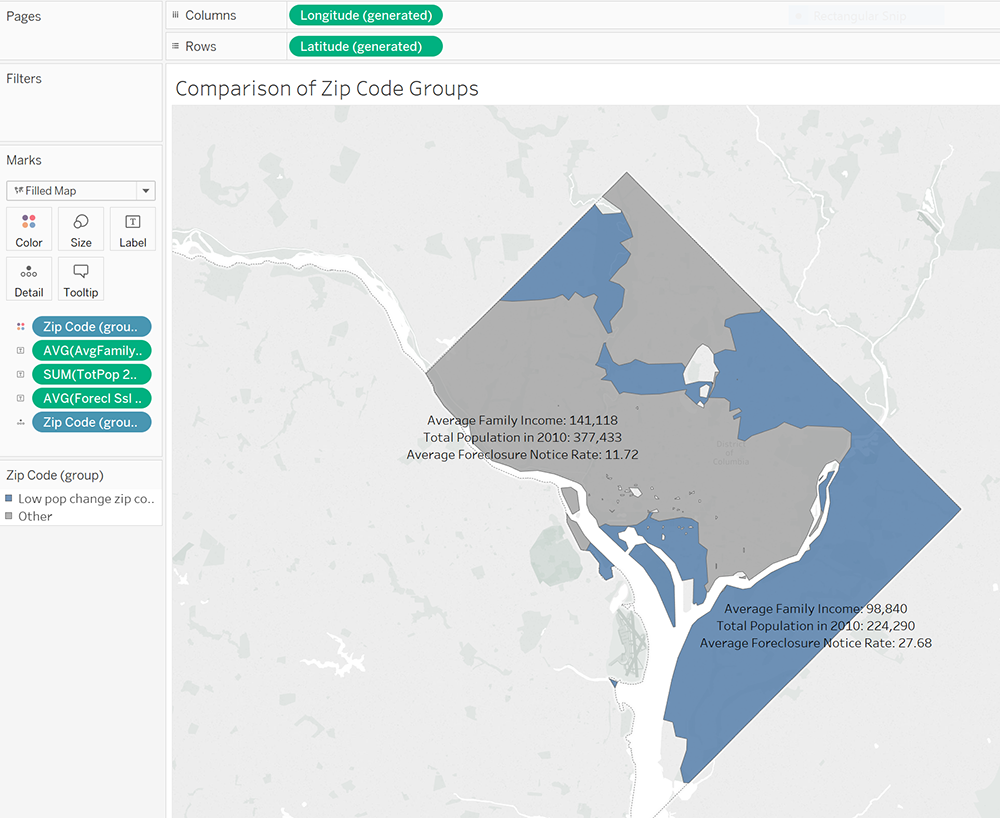
I can now use my new territories to create filled maps. Looking across the census data, we can see how the average family income in the low zip code territory is much lower than the average family income in the other zip codes. Furthermore, the foreclosure rate in the low growth zip codes is nearly three times the foreclosure rate for the other zip codes.
Custom territories can be used for both filled and symbol maps:
Tableau’s new custom territory feature can be applied in so many ways, across so many different sectors. Enjoy!