
Do you ever want to:
- Add text directly to your chart that is not a label, header or title?
- Label only specific points, ensure mark labels do not overlap or have different mark labels provide different information?
- Guide your user on how to interpret your visualization with commentary, questions or additional information without them interacting with your visualization (maybe you’re in the unfortunate situation in which your visualization must be printed?)
Annotations can be a great way to accomplish all of the above. Below are a couple good use cases for annotations.
Annotation Use Cases
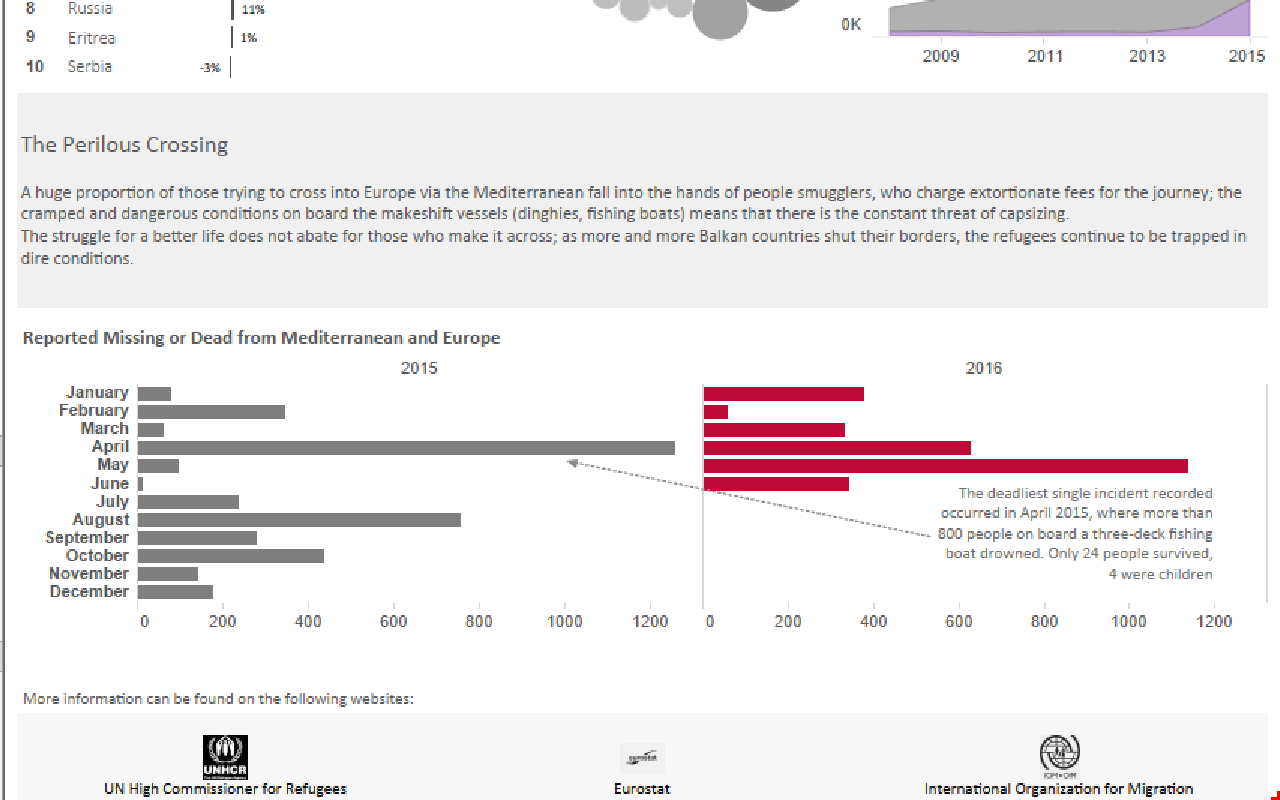
Here an annotation is used to add historical facts to the numbers in this viz about the European Refugee Crisis. This is a really good way to call out a significant spike in the data:
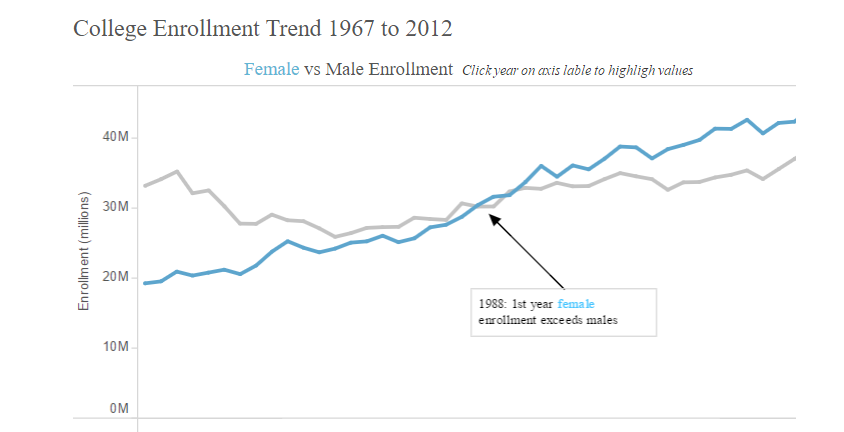
Here Dan Murray strategically uses an annotation to add context to his visualization showing male and female college enrollment:
Creating Annotations in Tableau
So, now you are convinced annotations will be a great addition to your visualization and you want to make a visualization annotation addition. First thing’s first: How to a create an annotation?
Left-clicking anywhere in the background of your visualization will open the pictured menu and under Annotate we see the option to annotate a mark, point or area. The option to annotate a mark is not available if you don’t click on a specific mark:
Point Annotations
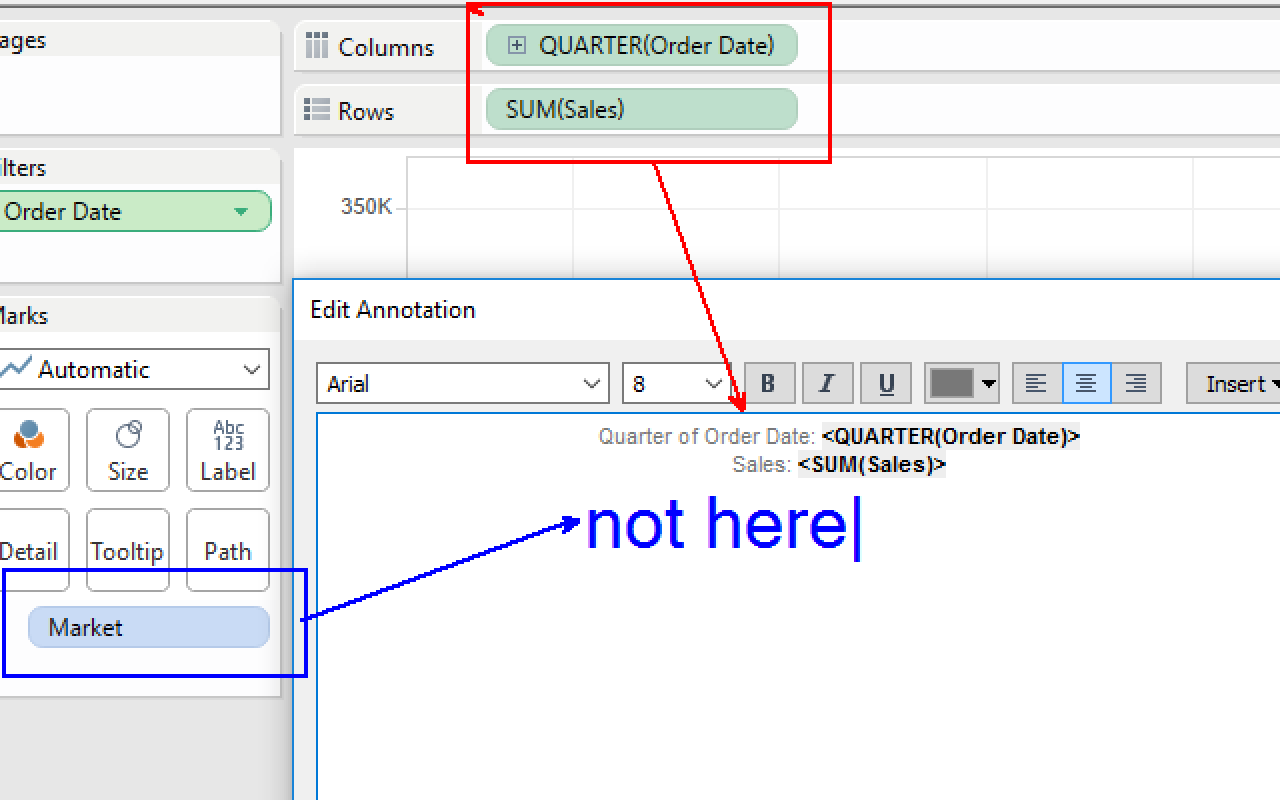
Point annotations reference a specific point, or X and Y coordinate on the visualization. This means:
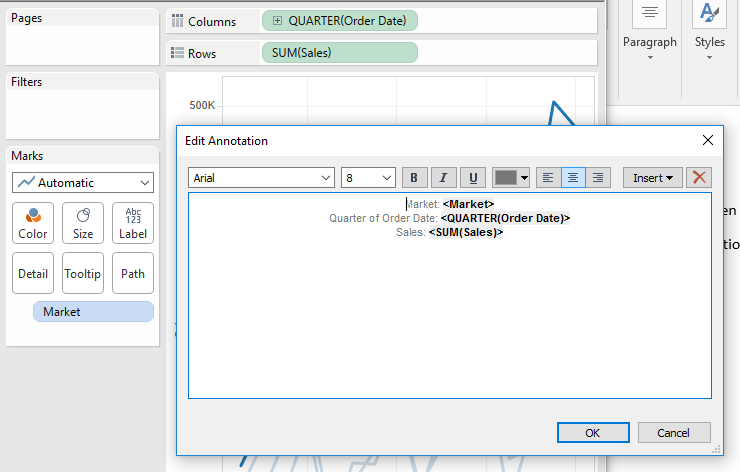
- The annotation text box auto-populates with only the data on columns and rows, not all of the detail in the view. In this case, when I have Market on detail, the point annotation does not include market, because the point is not connected to a market, only to a specific sales and quarter value:
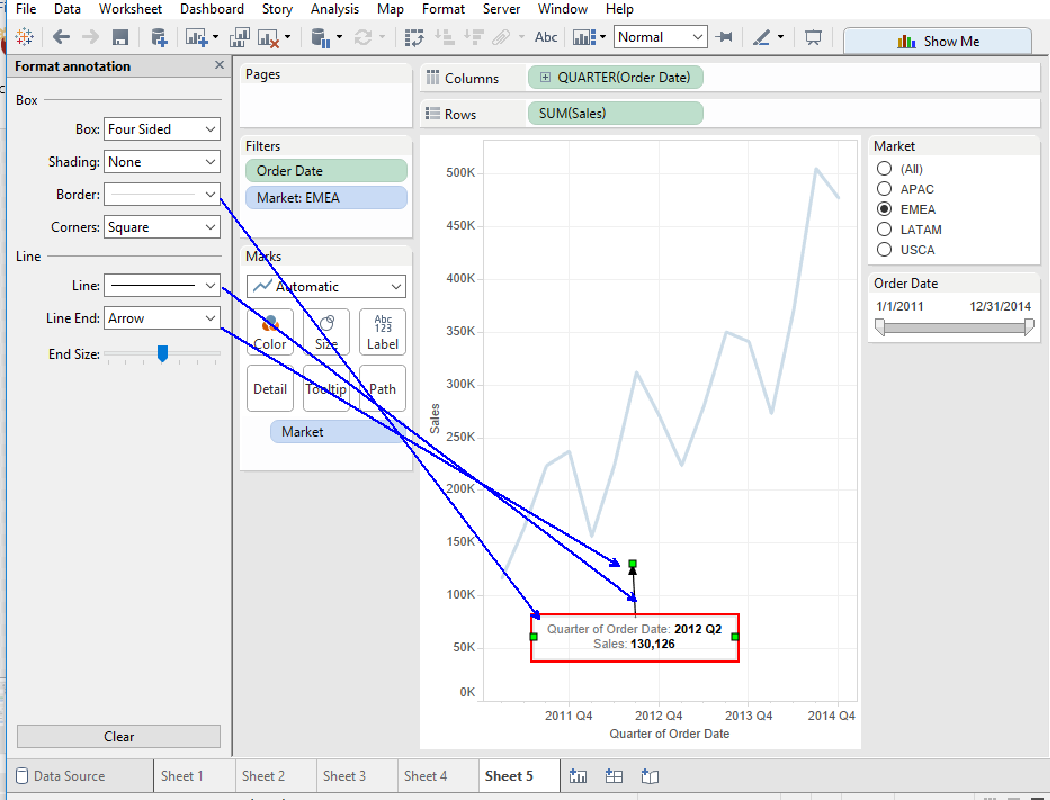
- The arrow of the point annotation can be directed at any point in the view. As I move the arrow in the below example, the data in the annotation text box updates:
- The point annotation will continue referencing a specific point, even if the view changes:
Area Annotations
Area annotations are similar to point annotations in that they reference a specific area on the visualization. Instead being tied to a single X and Y coordinate, the area notation references a group of coordinates on the visualization.
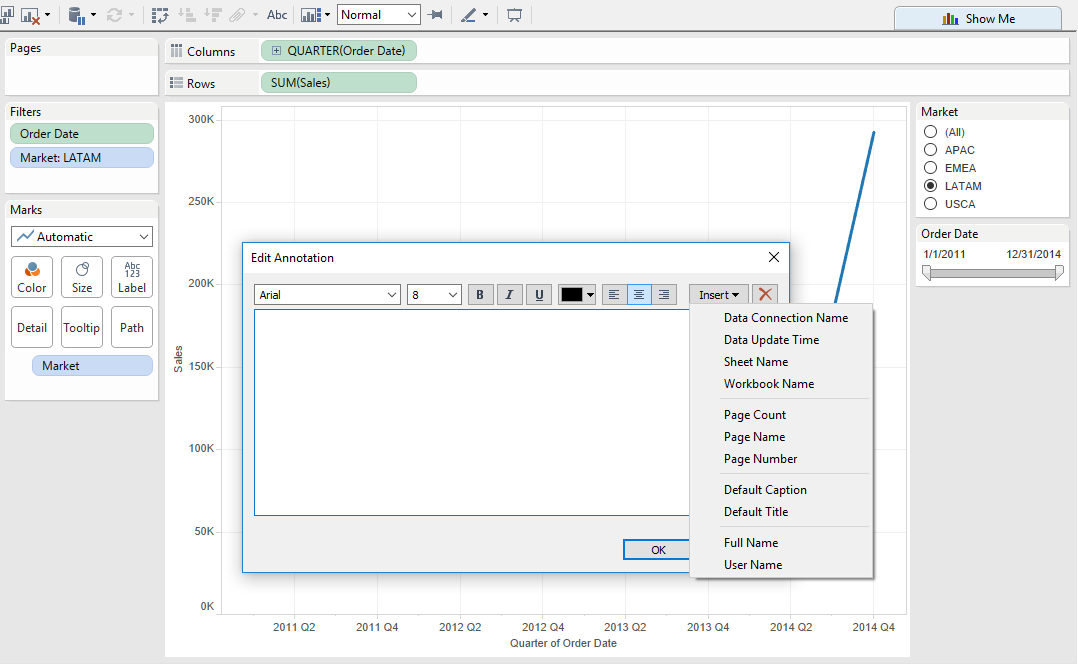
- The area annotation text box includes no pre-populated information because there is no specific point or mark information to include. You must type in the content you’d like to include. Unless you want to insert any of the values that are tied to the workbook by clicking the Insert drop-down menu. Notice, however, that no mark-specific information like measure or dimension values are available, because the area notation is not connected to specific data points:
- There is no arrow involved in an area notation since it doesn’t point out a location but an area.
- Area annotations behave similarly to point annotations because they continue to reference the same area regardless of how the visualization is filtered or updated:
Next Steps
Once you’ve got the annotation you want:
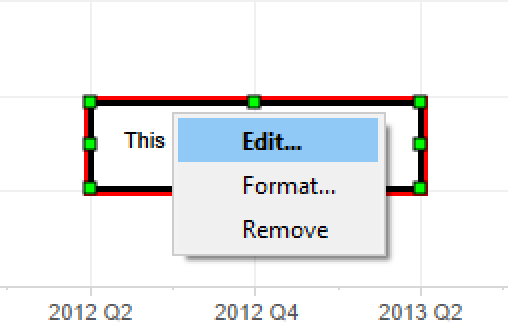
- Right-clicking on the annotation gives the option to edit it (which will bring you to a dialogue box that allows you to edit the content and format of the text inside the annotation):
- Now you probably want to know what format does, too. Format replaces your data pane with the format annotation sidebar, with the option to format the border, box style, arrow style and size:
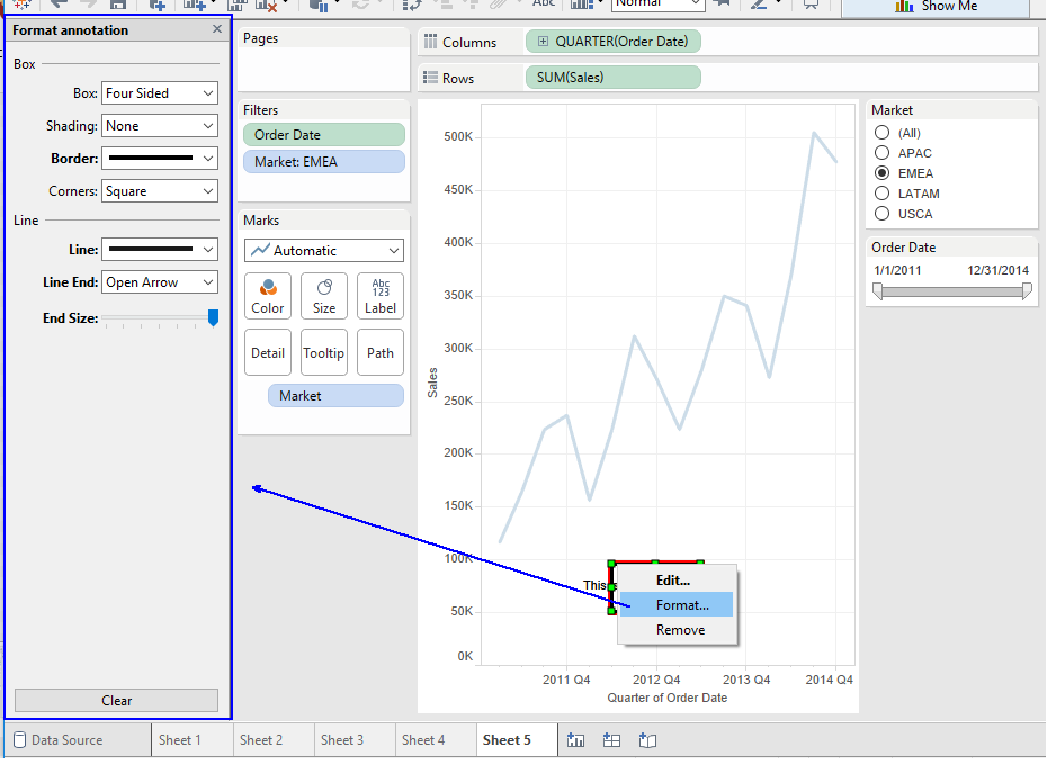
Format gives you the option to change the box shape, shading and border color and weight as well as the line and arrow used in point and mark annotations:
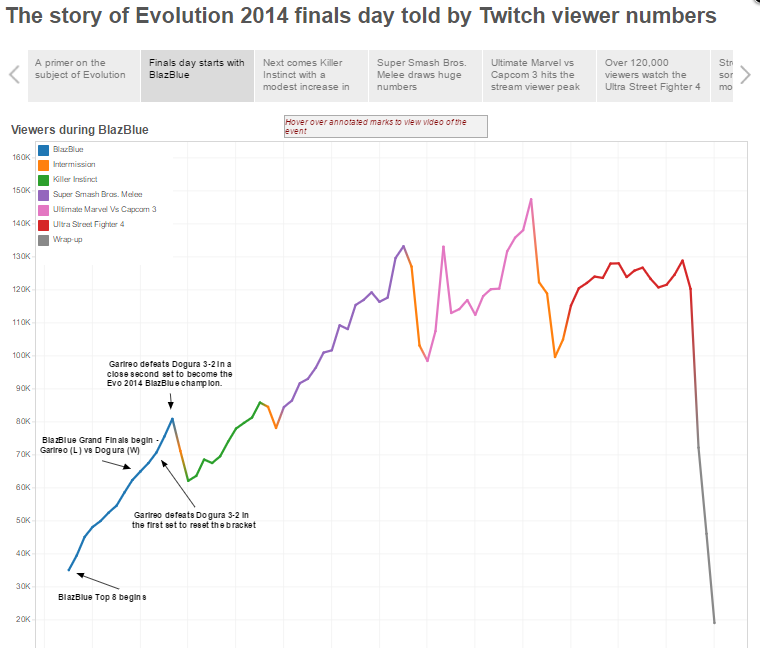
Now you know how to annotate your visualizations. You may want to check out this unique use of annotations to document the Evolution Championship Series (a gaming competition). The author, Brian Bickell, creatively uses annotations to make a very simple visualization incredibly meaningful and interesting:
Happy annotating!