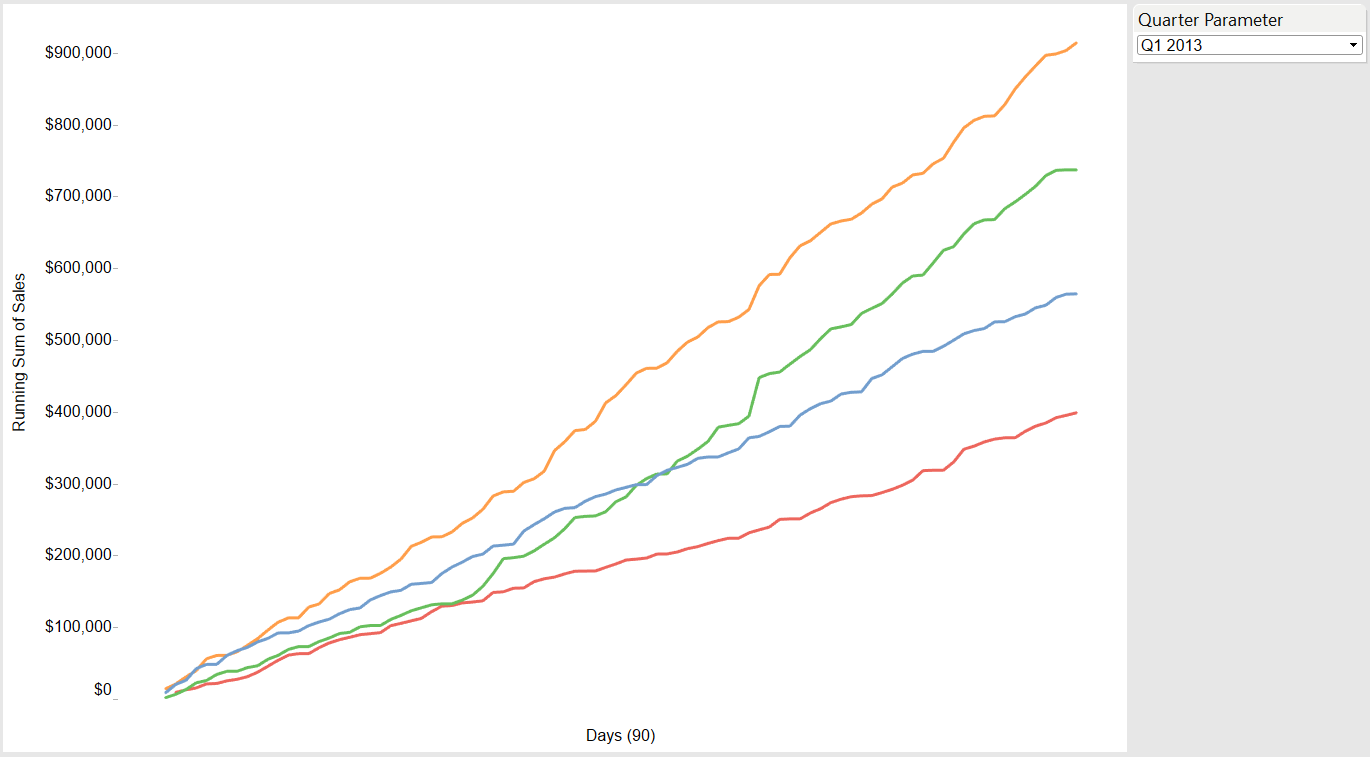
I was working with a client recently, and they asked me a seemingly simple question: “How do you compare quarterly performance across a single time frame in Tableau?”
They were looking for this:
My first thought was that this is very straightforward – all you should need to do is drag the performance metric to Rows, the time field to Columns and a copy of that same time field to Color on the Marks card. From here, we can create the view below:
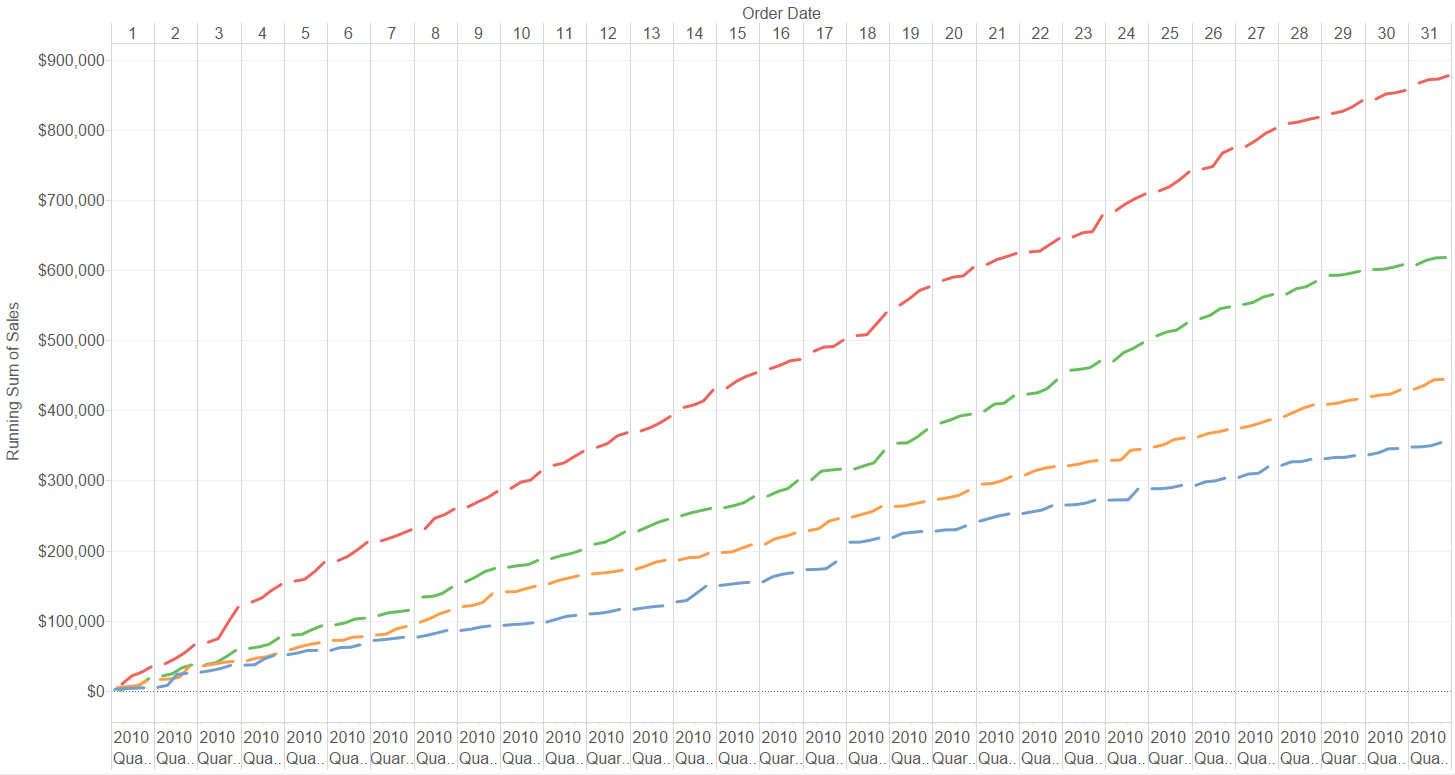
Not quite what we’re looking for.
Making Tableau Show the Full Quarter
Now let’s dive into how you can make Tableau show the entire 90-day spectrum (instead of just the Day date part we see now), all inside the same view, while displaying each quarter in its respective line and color. This will require a few calculations:
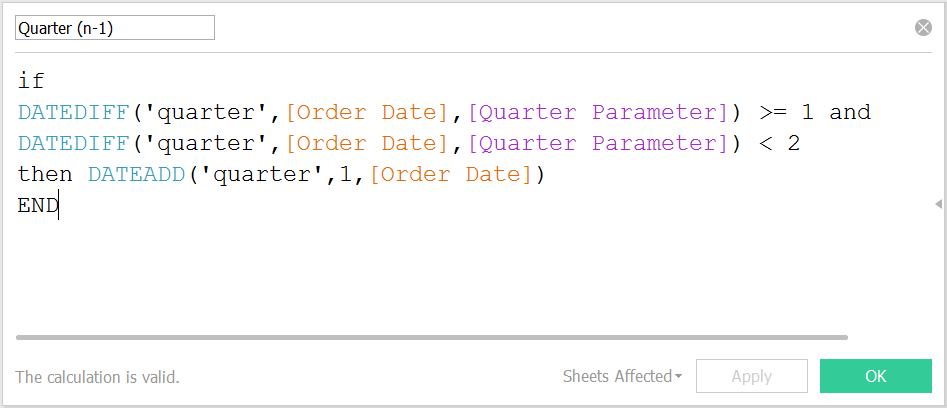
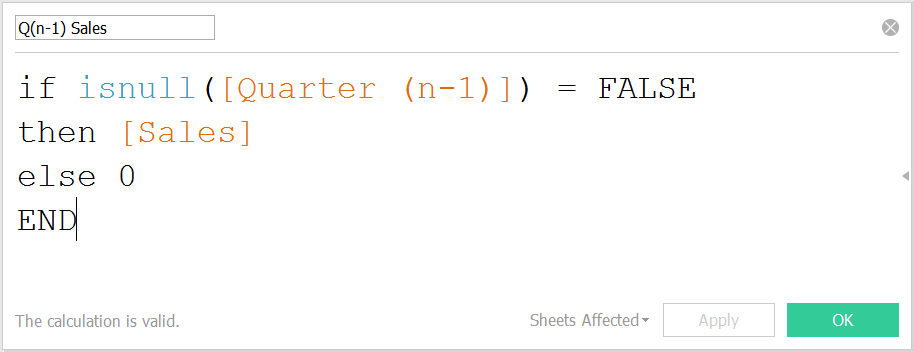
The calculation above is designed to search for dates that happened during the previous quarter when compared to the quarter we have selected as our Quarter Parameter. If you need to compare the selected quarter to other quarters in addition to the previous quarter defined above, then you will create more calculated fields like this one, adjusting the numerical values appropriately.
If you’re wondering what exactly that Quarter Parameter does, it simply creates a drop-down list of all the quarters we could use as our current frame of reference. Tableau will anchor the calculations around the time period I select within the parameter. See the two images below for a look at how to create the parameter.
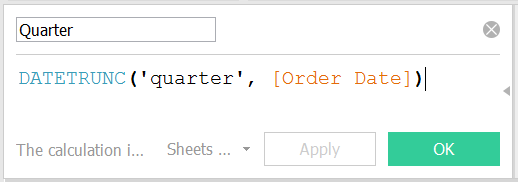
(Hint: To easily generate a quarter parameter, first create a calculated field that outputs the DATETRUNC quarter values for your date field.)
Now you can right-click on this Quarter field in the Data pane and create the parameter directly from the values it holds, thus outputting a list of the quarters present in your data:
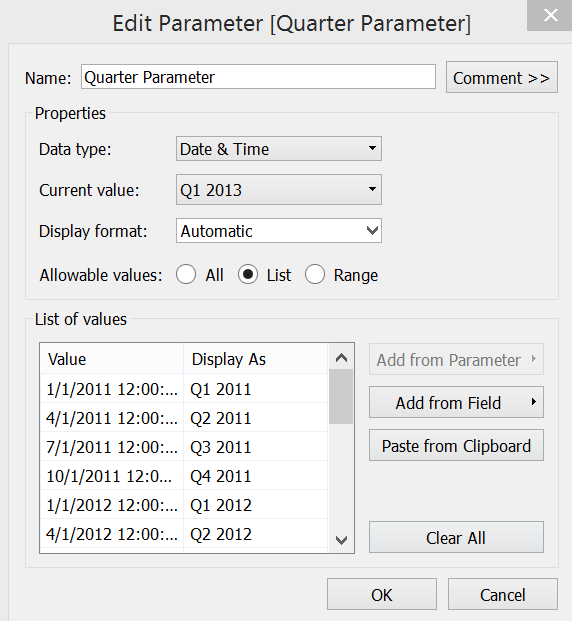
The contents of the parameter shown above were generated directly from the Quarter calculated field that was just explained.
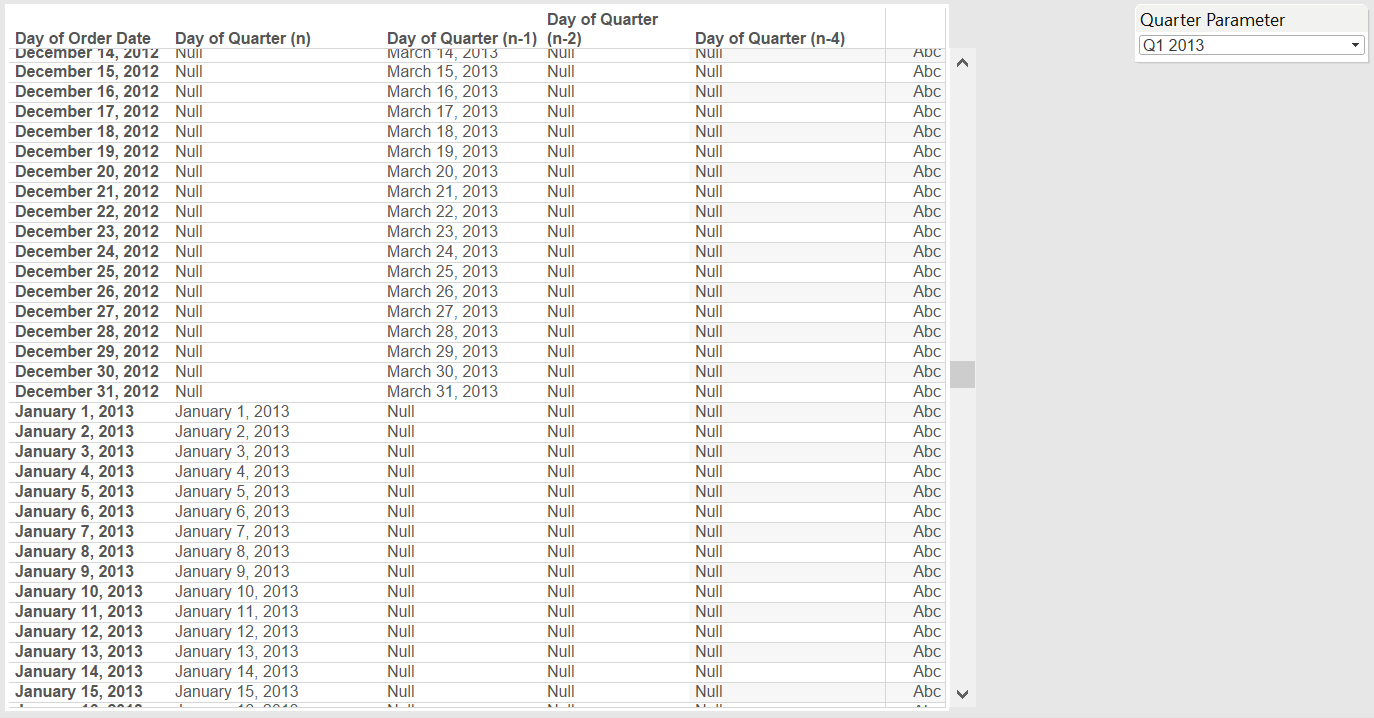
It’s always a good idea to double check that our formulas are outputting sane results. The view below serves the purpose of verifying that the Quarter (n-1) calculated field is shifting dates forward by one entire quarter. In the table, we can see that the Day of Quarter (n) column displays unaltered date values while Quarter (n-1) shifts its date values forward in time by exactly one quarter (dates in December 2012 become dates in March 2013). If we were to scroll through the table, we would find that Quarter (n-2) shifts its date values forward by exactly two quarters, and Quarter (n-4) shifts its date values forward in time by exactly four quarters:
Now we need to create a calculated field to store each quarter’s sales. Make a version of this calculated field for each quarterly comparison you would like to display:
We’re almost finished! There’s just one more calculated field. You can think of this formula as building the ground upon which your quarterly sales values will stand. We need to use this as our time axis when building the visual in order to display each quarter correctly.
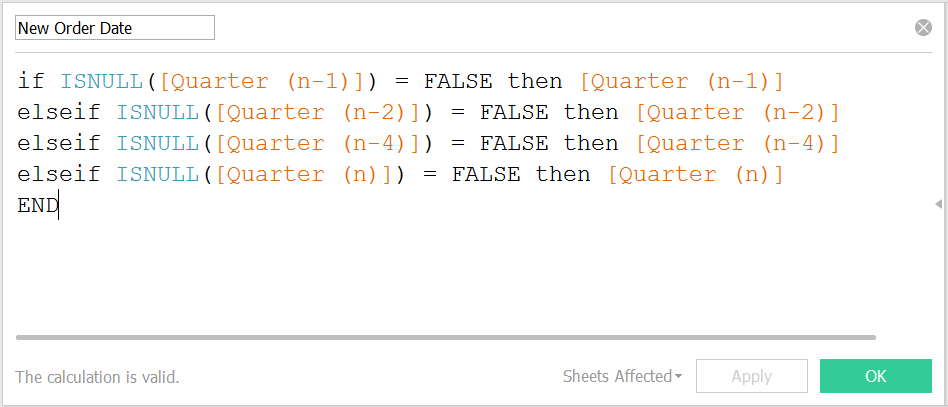
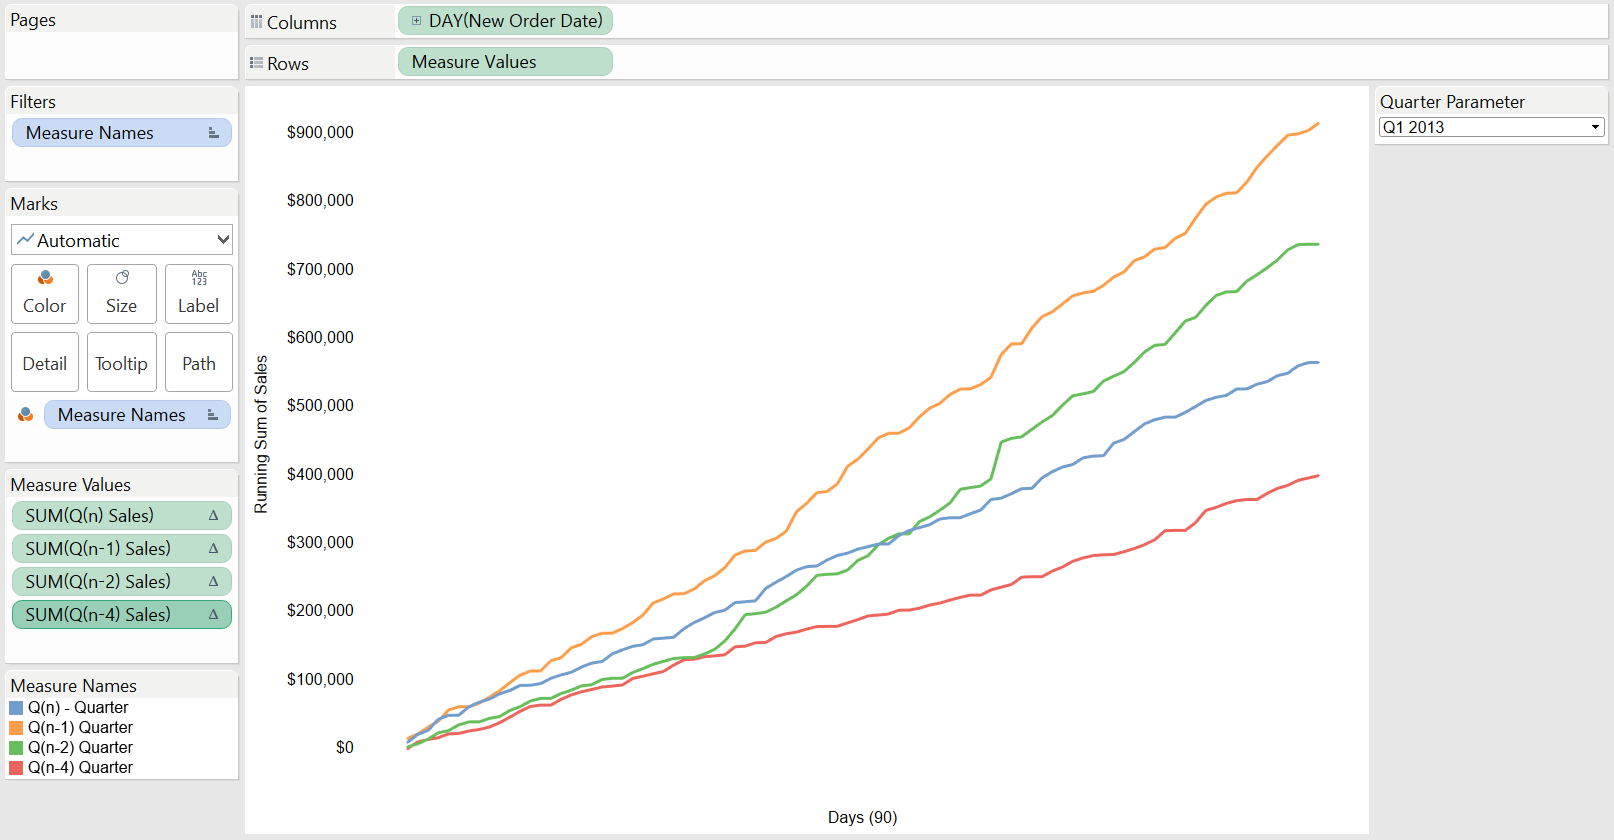
The final step is to put it all together! We can now drag all of our calculated fields into place in the view. The resulting visual is shown below. Note the date setting of New Order Date is continuous days. In the example, I have set each sales value to be quick table calculations showing the running sum of sales.