Questions from Tableau Training: How Do I Clear a Worksheet? Make a Copy?

Data

Questions from Tableau Training: How Do I Clear a Worksheet? Make a Copy?

by Jon Bajon
//

Our Certified Tableau Trainers are asked a myriad of questions each day. In this series, they share some answers.

Some pretty common questions heard in my Tableau training courses surround worksheets. Here’s a frequent two-parter:

“How do I clear a worksheet? How do I make a copy?”

Two Essential Tableau Worksheet Shortcuts

Students in training are always curious about the power of Tableau to make their lives easier. One of the ways Tableau can improve chart making capabilities is by providing numerous shortcuts to make visualization creation simpler. Today, let’s take a look at two worksheet tricks that will make you a more efficient chart builder.

Clearing Tableau Worksheets

When first building in Tableau, it is easy to rely on the Show Me menu to create fancy looking visualizations quickly. Unfortunately, many of us have experienced that every now and then our nice looking visualization may not look so nice.

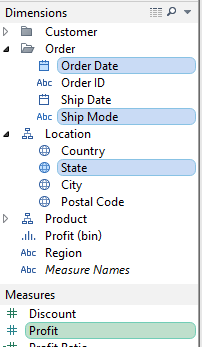
Let’s say that we want to build a visualization that uses Order Date, Ship Mode and State from our Dimensions and Profit from our Measures:

Build a Tableau Viz w/ These Dimensions

One of the many Show Me options is Lines (Discrete). When I click this type of visualization, my worksheet renders a very confusing and difficult to read graph. This graph has a great deal of noise and is not telling a clear story. A rule of thumb I follow is if the visualization is not clear to me, it definitely will not be clear to my report viewers.

Tableau > Show Me > Lines(discrete)” src=”/wp-content/uploads/sites/default/files/blog-content/QFTTWorksheetClear2Left.png” style=”margin-left: 12px; margin-right: 12px; float: left; height: 326px; width: 170px;” /></p>
<p><img alt= Lines(discrete)” src=”/wp-content/uploads/sites/default/files/blog-content/QFTTWorksheetClear2.png” style=”margin-left: 12px; margin-right: 12px; float: left; height: 354px; width: 500px;” />


Let’s try going with another Show Me option, the Filled Map since we are using State information:

Tableau > Show Me > Filled Maps” src=”/wp-content/uploads/sites/default/files/blog-content/QFTTWorksheetClear3Left.png” style=”margin-left: 12px; margin-right: 12px; float: left; height: 343px; width: 150px;” /><img alt= Filled Map” src=”/wp-content/uploads/sites/default/files/blog-content/QFTTWorksheetClear3.png” style=”margin-left: 12px; margin-right: 12px; float: left; height: 269px; width: 520px;” />


The Filled Map options shows the State information a bit better, but the information may be too detailed and small to quickly make informed decisions. After playing with a few more Show Me options, I might want to head back to the drawing board and start over. However, I have quite a few fields on Rows and Columns as well as my Marks card that I would need to remove first:

Tableau > Columns & Rows” src=”/wp-content/uploads/sites/default/files/blog-content/QFTTWorksheetClear4.png” /></p>
<p align=Tableau > Marks Card” src=”/wp-content/uploads/sites/default/files/blog-content/QFTTWorksheetClear5.png” /></p>
<p>Normally, I would have to remove each field individually, but using one of the <strong>Toolbar Icon Menu</strong> options I can remove all fields at once. The <strong>Clear Sheet</strong> button, located below the <strong>Story </strong>menu option, would be most efficient in this situation. The shortcut for this button is Alt + Shift + Backspace.</p>
<p align=Tableau > Clicking on Clear Worksheet” src=”/wp-content/uploads/sites/default/files/blog-content/Clicking%20on%20Clear%20Sheet.gif” /></p>
<p>Clicking the drop-down arrow to the left of the <strong>Clear Sheet</strong> button reveals a list of more independent options that can be chosen depending on what you have applied within your worksheet:</p>
<p align=Tableau > Clear Sheet Button” src=”/wp-content/uploads/sites/default/files/blog-content/QFTTWorksheetClear6.png” /></p>
<h4>Duplicating Tableau Worksheets</h4>
<p>Now that my worksheet is blank, I want to consider a different visualization to display the information I need. Using the same <strong>Dimensions</strong> and <strong>Measures</strong> as before, I created a simple text table with a <em>State</em> filter to provide the option of rotating through the different state selections:</p>
<p align=Tableau > Text Table” src=”/wp-content/uploads/sites/default/files/blog-content/QFTTWorksheetClear7.png” /></p>
<p>A text table is great for showing the numbers, but not the best way to graphically display the information. Let’s try making a <strong>Stacked Bar Chart</strong> to organize our output visually. Rather than messing with the text table worksheet or starting over from scratch, I want to utilize Tableau’s <strong>Duplicate Sheet</strong> button located in the <strong>Toolbar Icon Menu</strong>, right next to the <strong>Clear Sheet</strong> button:</p>
<p align=Tableau > Clicking on Duplicate Worksheet” src=”/wp-content/uploads/sites/default/files/blog-content/Clicking%20on%20Duplicate%20Sheet.gif” /></p>
<p>The <strong>Duplicate Sheet</strong> button will make a copy of whatever is on the current worksheet and place that copy on a new worksheet. This is extremely useful for times when you want to preserve a worksheet and experiment with changes. I often use <strong>Duplicate Sheet </strong>as a quick start for enhancing an older visualization.</p>
<p><img decoding=

There are many useful buttons on the Toolbar Icon Menu that can drastically speed up your chart building skills, and understanding the Clear Sheet and Duplicate Sheet buttons is a great first step.

Want More Questions from Tableau Training

  1. Questions from Tableau Training: Quick Filter Interaction
  2. Questions from Tableau Training: Labeling with Table Calculations
  3. Questions from Tableau Training: Speeding Up Presentation Views when Using Tableau
  4. Questions from Tableau Training: Dashboard Actions
  5. Questions from Tableau Training: Business Day Calculations
  6. Questions from Tableau Training: Adding Gaps Between Bars
  7. Questions from Tableau Training: When to Pivot Data in Tableau
  8. Questions from Tableau Training: Adding Conditional Formatting
  9. Questions from Tableau Training: Setting Weekday Start
  10. Questions from Tableau Training: How Do ZIP Codes Work in Tableau?
  11. Questions from Tableau Training: The Small Grey Bar Within a Quick Filter
  12. Questions from Tableau Training: Matching Mark Color
  13. Questions from Tableau Training: Showing the Null Indicator
  14. Questions from Tableau Training: Can I Manually Set the Colors of a Stepped Gradient?
  15. Questions from Tableau Training: How Can I Get Box Plot Data into a Crosstab?
  16. Questions from Tableau Training: How Do I Clear a Worksheet? Make a Copy?
  17. Questions from Tableau Training: Opening URL Actions Inside of a Dashboard
  18. Questions from Tableau Training: Can I Move Mark Labels?
  19. Questions from Tableau Training: How Can I Use My Current Report to Create a Viz?
  20. Questions from Tableau Training: Can I Create Text Hyperlinks on a Dashboard?
  21. Questions from Tableau Training: How Can I Transform My Crosstab into a Flat List?
  22. Questions from Tableau Training: Labeling the Top N
  23. Questions from Tableau Training: How Can I Customize Charts with Parameters?
  24. Questions from Tableau Training: Combining Measures into a Single Line
  25. Questions from Tableau Training: How Can I Create Custom Color Palettes?
  26. Questions from Tableau Training: Can a Top N Parameter be Nested Within Other Fields?
  27. Questions from Tableau Training: Conditional Scope on Tableau Calculations
  28. Questions from Tableau Training: Top Ten Plus N
  29. Questions from Tableau Training: Dynamic Label Positioning
  30. Questions from Tableau Training: Using Cross Joins to Solve Active Tickets
  31. Questions from Tableau Training: Top N Highlight Table
  32. Questions from Tableau Training: How to Use Specific Dimensions in Table Calculations
  33. Questions from Tableau Training: Moving Reference Line Labels
  34. Questions from Training: Comparing Metrics for Same Weekday in Previous Year
  35. Questions from Tableau Training: Colouring Specific Columns and Rows in a Crosstab
  36. Questions from Tableau Training: Creating a Custom Legend as a Sheet
  37. Questions from Tableau Training: How Can I Draw a 45-Degree Angle?
  38. Questions from Tableau Training: Down the Aggregation Rabbit Hole
  39. Questions from Tableau Training: Percent Change from Previous Period on a Map
  40. Questions from Tableau Training: Union File Names as Years
  41. Questions from Tableau Training: Conditional Coloring on Sparklines
  42. Questions from Tableau Training: Moving Column Headers to the Top of the View
  43. Questions from Tableau Training: Isolating Rank with Parameters and Calculations

More About the Author

Jon Bajon

Analytics Consultant
Tableau Viz: How Much Heat Can You Handle? It might sound controversial, but a common practice in my family (and many families throughout Louisiana) was something called ...
Questions from Tableau Training: Can a Top N Parameter be Nested Within Other Fields? The latest question from Tableau Training comes from Ryan, who was in a DII: Intermediate course in New York City. “I know I can ...

See more from this author →

InterWorks uses cookies to allow us to better understand how the site is used. By continuing to use this site, you consent to this policy. Review Policy OK

×

Interworks GmbH
Ratinger Straße 9
40213 Düsseldorf
Germany
Geschäftsführer: Mel Stephenson

Kontaktaufnahme: markus@interworks.eu
Telefon: +49 (0)211 5408 5301

Amtsgericht Düsseldorf HRB 79752
UstldNr: DE 313 353 072

×

Love our blog? You should see our emails. Sign up for our newsletter!