It might sound controversial, but a common practice in my family (and many families throughout Louisiana) was something called “hotsaucing.” What exactly is that? When your a kid acts up, you punish them by making them eat a little bit of hot sauce. The jury is still out on whether it taught me discipline, but it DID help me develop a love for hot sauce that I still hold dear today.
In my travels at InterWorks, I’ve done many hot sauce challenges across the country (you know, the one’s you see on shows like “Food TV,” “Man vs Food,” etc) and am always pushing my limits. The hotter the better. I also collect hot sauces, so I’m always looking to expand my collection and try new things. But the passion doesn’t stop there. I even carry hot sauce bottles with me to Tableau training! Since it’s clear that hot sauce is life, I wanted to make a dashboard to showcase my love of hot sauce and data.
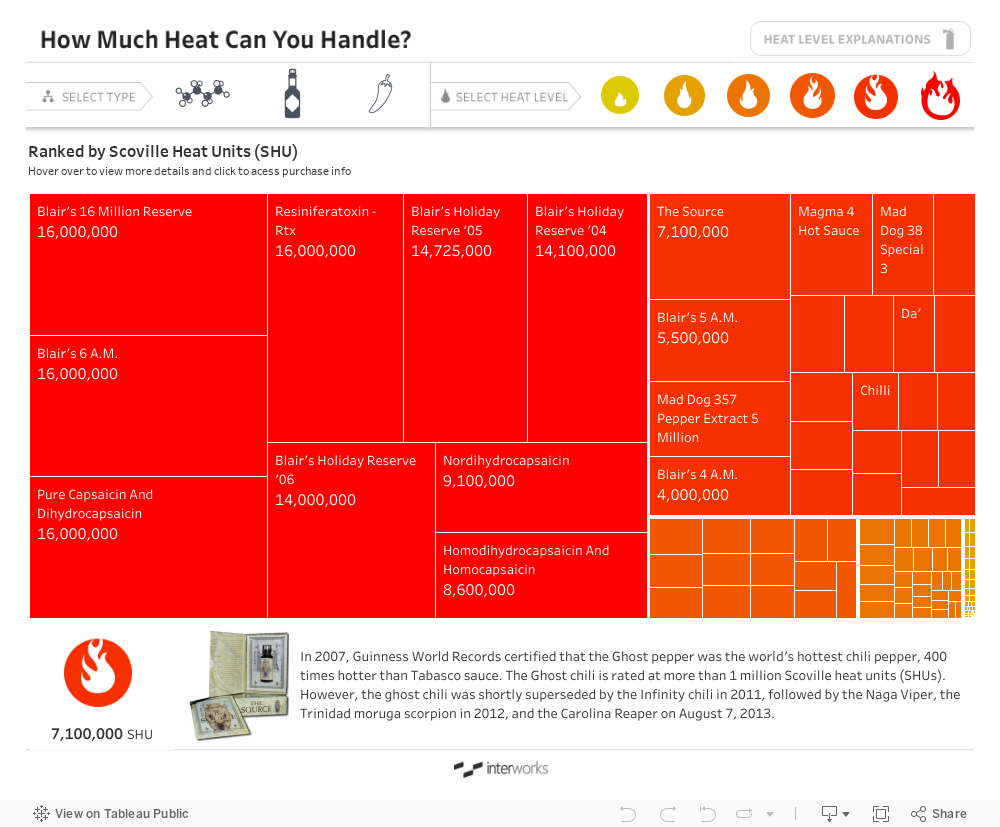
Breaking Down the Heat
I kept the viz pretty simple with a treemap that shows the world’s hottest edible substances ranked by their number of Scoville Heat Units (reflected by the size of each square) and Heat Level (reflected by a red-orange-yellow color spectrum). In the top-left, you can filter the treemap by substance type (the options being Chemical, Hot Sauce and Pepper). The top-right features an explanation of the different heat levels. Finally, clicking on any one square will populate a description of that substance in the space below the treemap.
That’s it! Feel free to explore the viz below on your next lunch break, and be sure to dab on a little of your favorite hot sauce for me.