
The Tableau Performance Checklist series is designed to help you streamline your dashboard performance and Tableau Server configuration. Each post expands upon one item listed in the master Tableau Performance Checklist. As of 2024, you can find an updated Tableau Dashboard Performance Checklist here.
Next up on the list of ways to make your dashboards be the best they can be, we take a closer look at blended calculations:
“Limit blended calculations. They require sequentially querying multiple data sources and can be time-consuming. Where possible, create a view on the database server.“
Occasionally, all of the information we need to tell compelling stories visually is nicely stored and prepared for us ahead of time. This is usually the result of hard work on the back end from our IT or Data Management teams (thanks guys!). Most times, however, this fairy-tale scenario isn’t how our data visualization journey begins. Rather, we slog through numerous data sources scattered across different platforms, servers, etc. Even with considerable data management efforts, there still may be a couple of disparate sources that need a little TLC in order to produce valuable insight.
Blended Calculations
Tableau’s answer to this situation is the blended calculation, in which fields from more than one data source can be used in a single calculated field. For example, let’s say you need to need to produce a global sales figure across your organization, but each region’s autonomy in its data management practices means that the data is stored across four or five separate locations. You may be tempted to use Tableau to build the following calculation to yield your global sales figure:
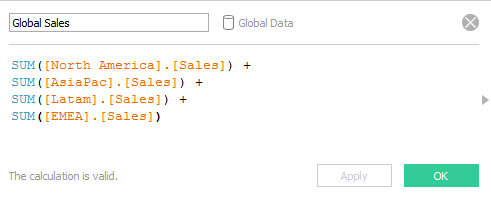
Steer clear of this temptation! While Tableau’s intuitive interface makes this kind of calculation very easy to create, it is less than ideal when considering the performance implications on your visualizations.
Potential Problems
Using blended calculations in Tableau is possible, but it’s not preferable. When you reference more than one data source in your calculated field, Tableau must individually query each data source separately to retrieve the values for your calculation. Remember this rule: Your visualization can only be as fast as your slowest data source.
Not only do you run the risk of waiting on a particularly slow data source, but you’re forcing Tableau into extra steps to pull down the data required to complete the calculation. That incrementally adds to the loading time of your visualization, which can be rather onerous with large data sets.
But abandon not hope, ye who enter. In the case of our example discussed above, a better alternative to a blended calculation would be to prepare a new view on the database server. This keeps the data processing and querying outside of Tableau and allows the tool to do what it does best – quick and flexible data visualization.
Performance Analyzer
The good news is that our Performance Analyzer tool, part of our Power Tools for Tableau suite, peeks under the hood of your workbooks to check for blended calculations along with other items. It will even show you the specific calculation potentially causing slowed performance, like so:

So, for the low, low price of free, why not take the Performance Analyzer (and really all of the Workbook Tools) for a two week spin to see all the ways it can make your Tableau life easier? Download now and run your workbooks through to see what other tips and tricks you can discover. A few seconds to complete each analysis and receive expert advice, knocking your dashboards into tip top shape, seems like a no-brainer to me. Furthermore, you’re getting the functionality of a collection of other tools bundled with the Performance Analyzer.
Think “Efficiency”
Calculations are a very powerful feature in Tableau Desktop, but we would do well to keep in mind Uncle Ben’s wise words on great power. In many cases, a bit of extra prep with your database administrator at the data layer goes a long way in achieving the same visualizations far more efficiently. Of course, this takes a bit of up front consideration when it comes to the questions you want to ask or stories you hope to tell, but many Tableau experts stress the importance of this design and planning stage in their own work. So, once we’ve planned out our brilliant dashboard, let’s make sure the data to build the story is prepared ahead of time and avoid the spinning wheels that often come hand in hand with blended calculations.
Mastering Best Practices
If you’re interested in becoming a Tableau Server guru, then learning these performance best practices is essential. Check back frequently as we add new posts and dive deeper into each point in the Tableau Performance Checklist.
Another great way to identify best practices is to leverage the insights offered by our Performance Analyzer, part of Workbook Tools for Tableau. It will examine all of your workbooks, worksheets, dashboards and data sources against a list of best practices to ensure that you’re using all the tips and tricks to guarantee your visualizations are moving at light speed.
As always, feel free to get in touch with us if you have any questions regarding performance or anything Tableau related! We’d be happy to help.