
With nearly three years under my belt as a resident of New York, I’m still a relatively fresh newcomer to the city. And while I love this city and could talk your ear off about the many reasons why, I’ll admit that there are plenty of aspects I could do without. Enter the 311 data set, courtesy of NYC’s Open Data project, to help me demonstrate. Here we have a data set of calls phoned into the city’s complaint registry number. Click around to explore further – there are some interesting occurrences people have called in about:
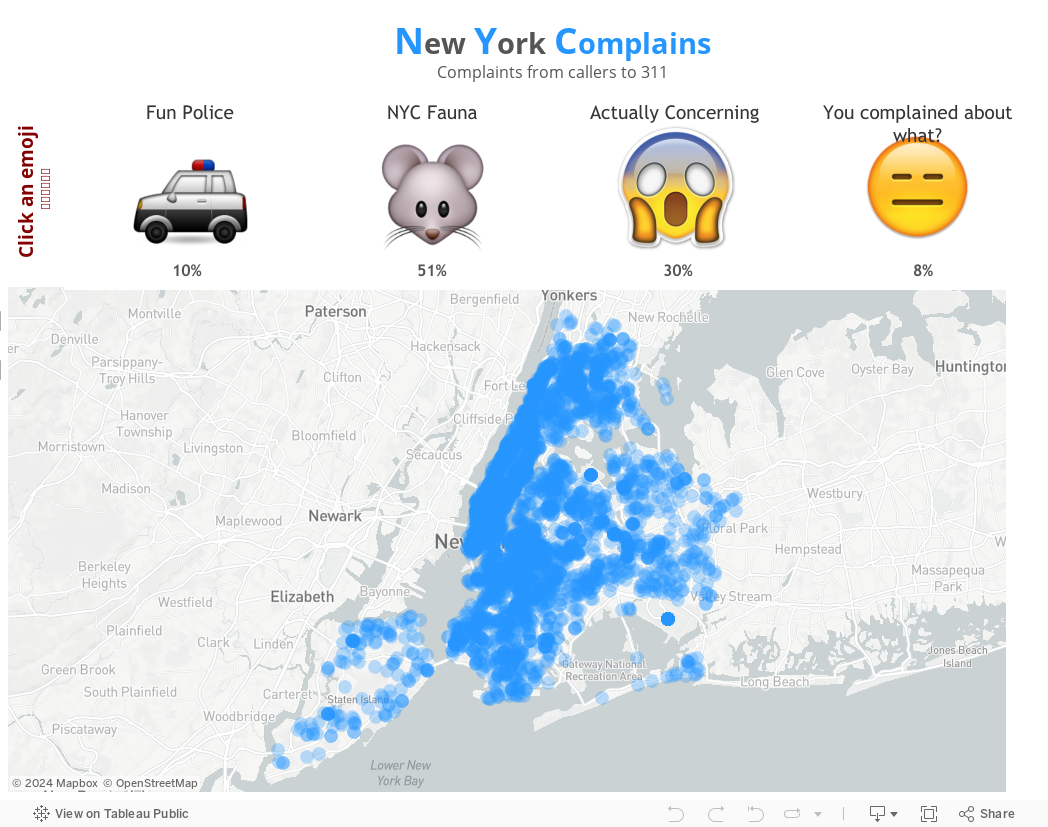
This isn’t all of the complaints – not by a long stretch. My exploration was out of pure curiosity; I went through each of the categories of complaints and chose what spurred my curiosity. It’s not often I hear of roosters in the city, and I was pretty curious as to what constitutes an “Illegal use of a hose at a private residence.” As a musician, I was also a bit disappointed in the complaint against a musical instrument, of course placing it under the “Fun Police” category.
Breaking Down Design
Taking a step back to look at this from a design perspective, I find that some dashboards can be intimidating upon first glance, especially when we try to throw all of the answers at the user at once. With this dashboard, I made the initial view as simple as possible, answering two questions:
- What are people complaining about?
- Where is it happening?
But once a complaint grouping is chosen, the dashboard reveals additional charts and filters to glean greater insights.
The Power of Simple Dashboards
Just because a dashboard doesn’t answer ANY question your users may dream up doesn’t mean it’s not a good dashboard; often we find quite the opposite to be true. Simplicity is often mistaken as wasted potential – “That’s great! Let’s add x, y and z too!” – but I find that many of my and my colleagues’ favorite dashboards are the most straightforward (James’ DidDukeWin.com or Brad’s IsItChristmas.com, are a couple of examples that come to mind). They don’t answer every question under the sun, but they serve the purpose they were designed for perfectly.
Such was my goal with this dashboard – I am able to share with you the dark side of living in New York City in a quick, easy and clean way. Just keep in mind that one of those rat sightings may just be the infamous Pizza Rat!