
During the summer months, you’re more likely than not to find me out on the Illinois River. Although I’m not hugely competitive, sailing brings out the athlete in me. In 2017, I participated in Saturday morning racing at the Illinois Valley Yacht and Canoe Club (IVY Club) in Peoria, Illinois. I sailed (really, I was a foredeck in training) on a Capri 22 named Rozinante.
Throughout the season, we had six primary boats that raced against each other, edging each other out to win races and ultimately win the season. We held our awards ceremony a few weeks ago, where each boat’s place in races throughout the season were averaged together to see who had the best overall record. With all this data, I thought it would be fun to create a visualization of the results of the season.
Preparing the Data in Alteryx
To begin, I took the raw data published on the IVY league website, and reshaped it using Alteryx. Dates were across the columns in my original data, so I wanted to pivot or transpose those. I could do this in Tableau as well, but Alteryx made other aspects of cleaning my data easy, such as having multiple races on the same day. When the same date occurred twice, Alteryx simply added a _2 to the end of the second one, so I was able to identify the unique races. Lastly, I added a column to assign an ID or Order to each race in Alteryx. With my data cleaned and ready to go, I brought it into Tableau.
Creating a Bump Chart in Tableau
In Tableau, I knew I wanted to create a bump chart. To do this, I created a dual-axis chart by duplicating Place, with it being a shape (sailboat) for one axis and a line on the other. I brought the unique Race ID to Columns, moved Boat to Detail and created the following chart:
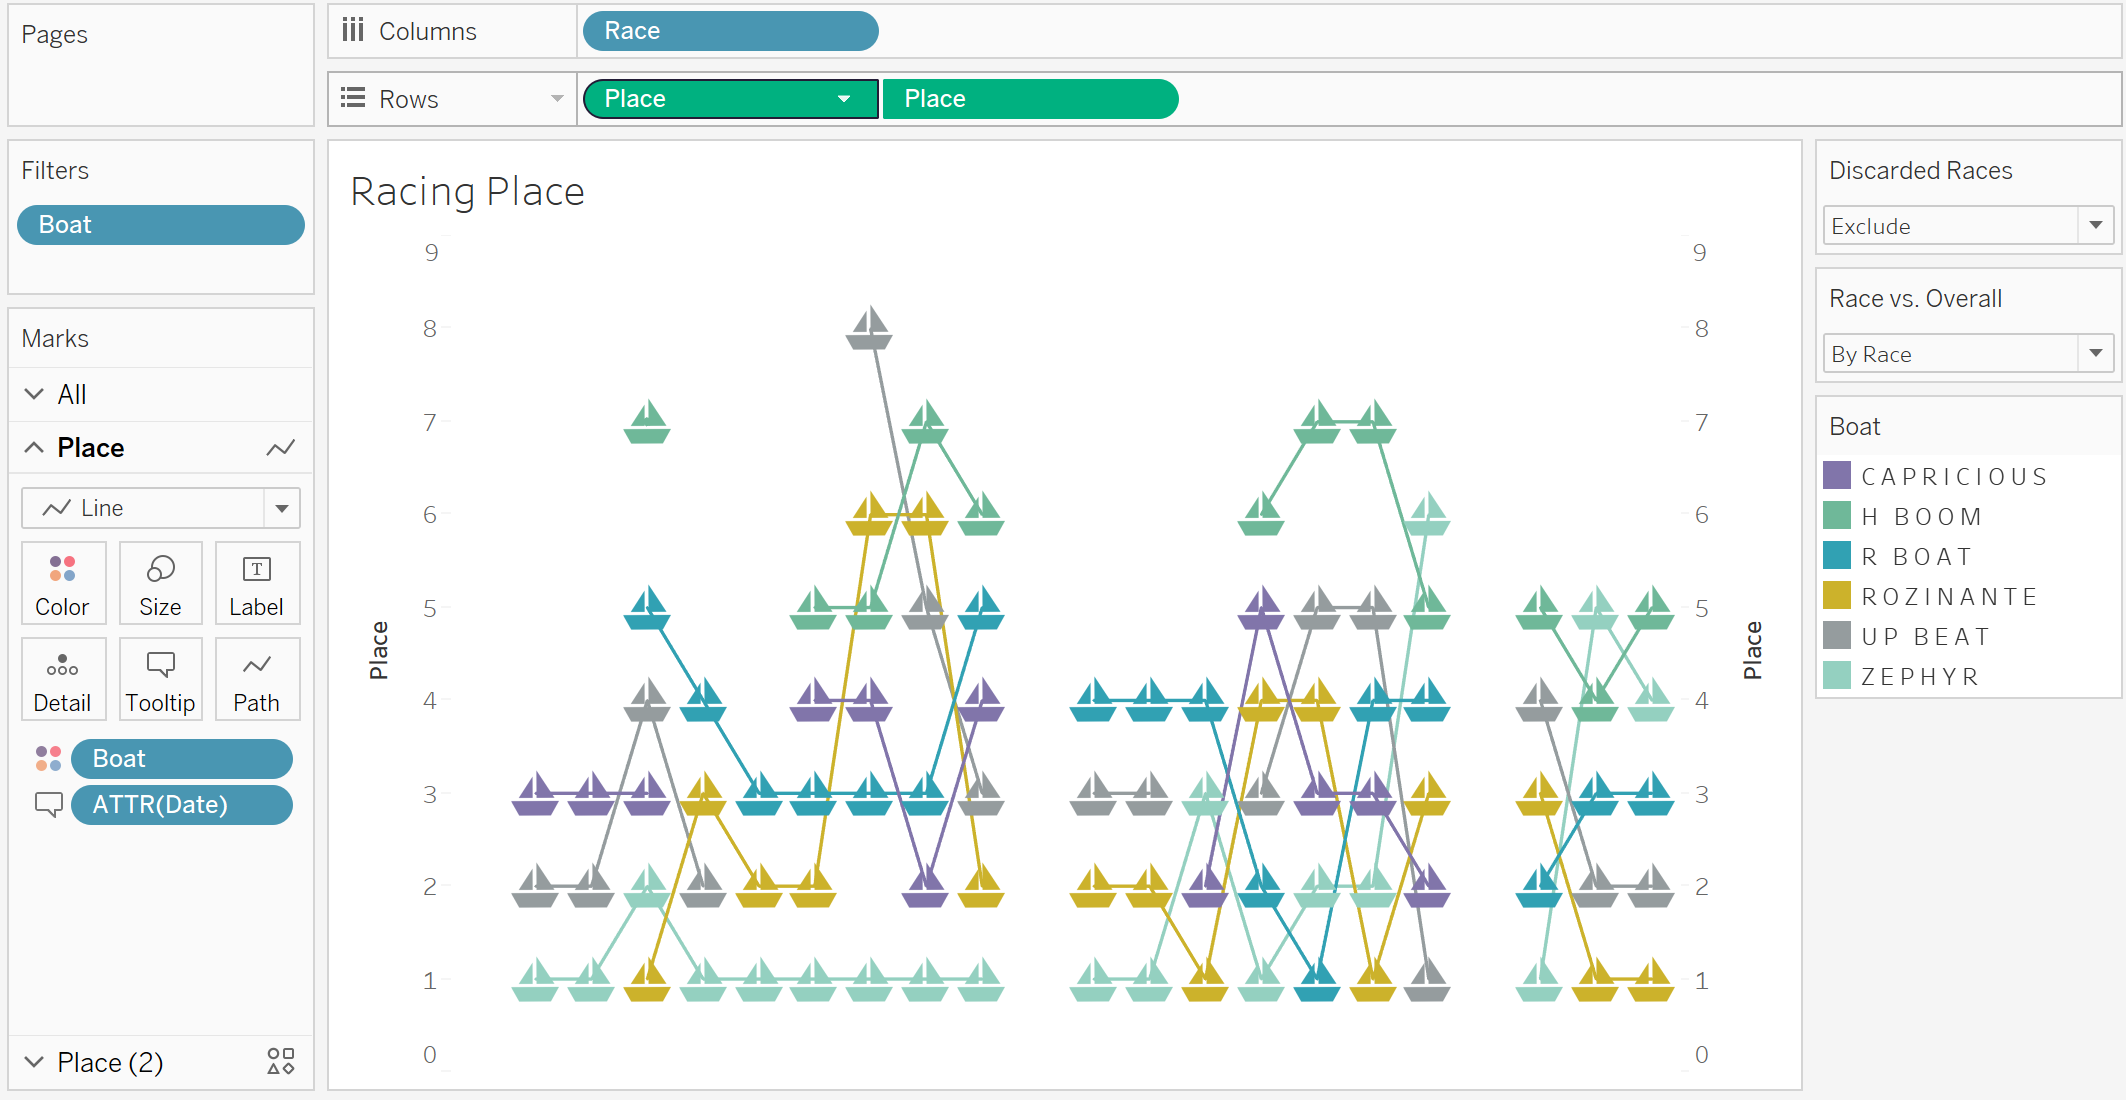
From a formatting perspective, I wanted the tooltip to be really informative, so I brought in the day, race number and the place each boat got on each day. Next, I reversed the Place axis since I wanted 1 to be at the top, and I wanted to fix the axes to only show the places 1-8.
Note: Even though there were only six boats, other boats occasionally participated although they didn’t qualify for final placement in the season
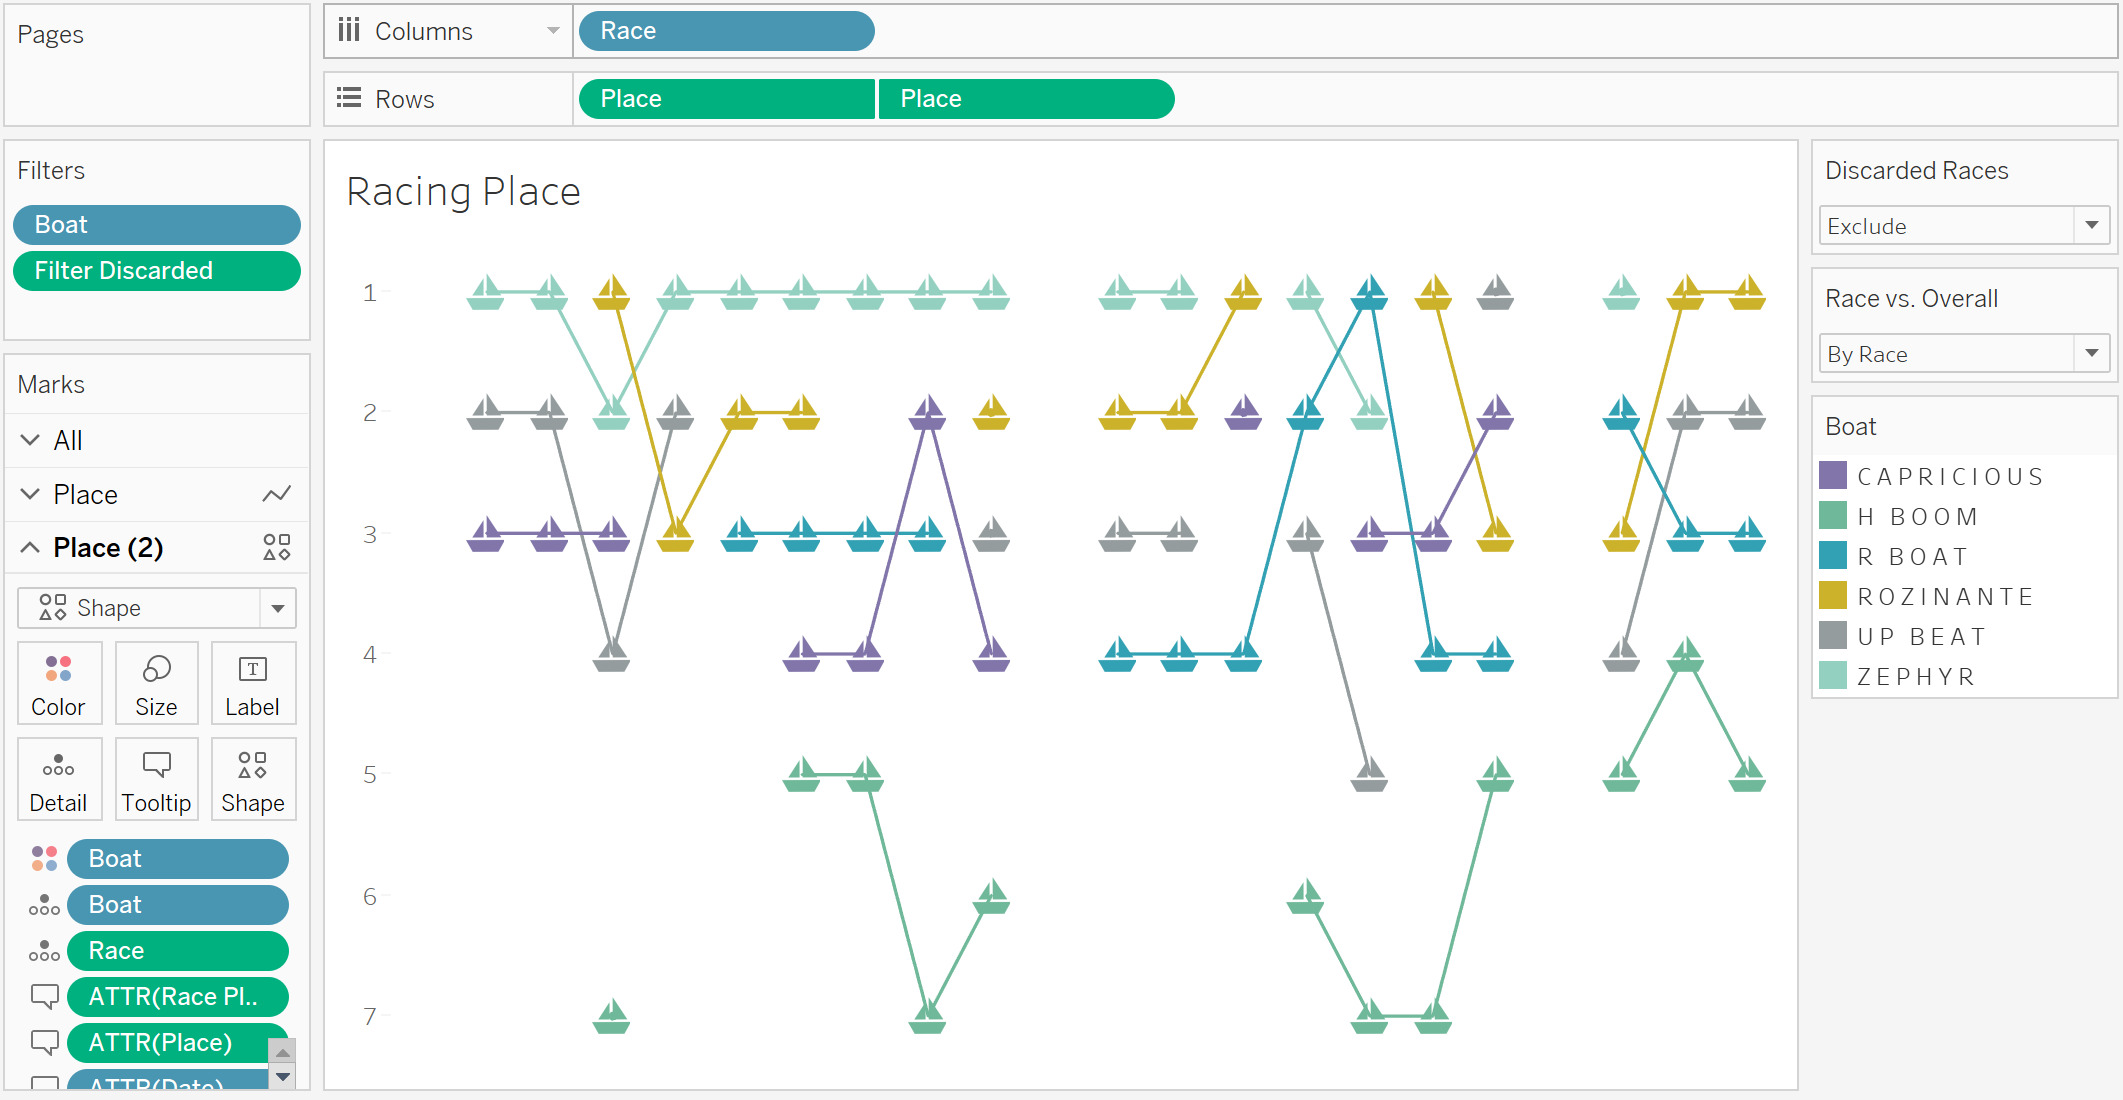
Lastly, before final rankings, racers can throw out any races above ten. I flagged all races that competitors chose to discard in their final rankings, then I created a parameter that stipulated whether users could see all races or just those included in the final rankings. The place then updates based on this selection. The final sheet looked like this:
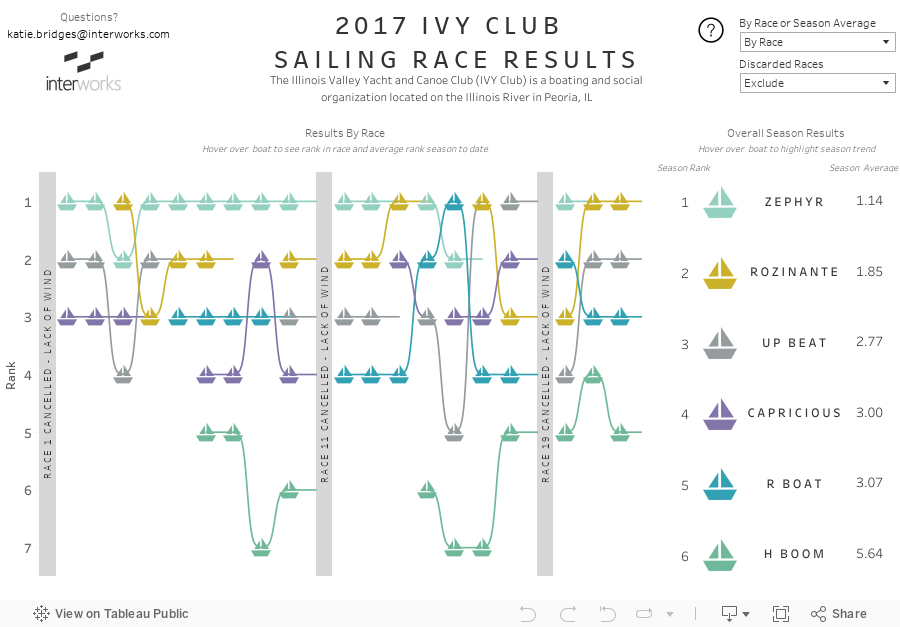
On the dashboard, I decided to create a Final Rankings table that interacted with the bump chart. I added some text boxes giving information about race cancellations and chart headers and huzzah!
A Little Analysis
Interestingly, when looking at all races, Up Beat came in fourth place. But after discarded races, Up Beat actually ranked third. Looking at the moving average throughout the season (excluding races that were thrown out), you can also see Capricious and R Boat battled it out for fourth place from Race 14 to the end of the season. The boat I raced on, Rozinante, finished out a solid second, although we briefly dipped to third after Race 9 before throwing out our lowest ranking races.
I shared the viz with my sailing team, and it received much positive feedback. Teams loved being able to see how the thrown-out races influenced their final score, as these results are not typically available. They also expressed an interest in seeing their running average throughout the season next year, so they can know exactly where they stand week to week.
I’ll definitely look at keeping this up to date when I get back on the water next season!