
Tableau uses filters, groups and sets to organize data. They were each created for a specific purpose, but differentiating between use cases can be difficult at times. The purpose of this post isn’t a step-by-step guide in creating them; rather, it is a quick guide to “when” or “why” they would be used.
First, let’s get some actual definitions from Tableau:
Filter: A dimension or measure that narrows the data shown in a view to focus on relevant information.
Group: Simplifies large numbers of dimension members by combining them into higher-level categories.
Set: A subset of your data that meets certain conditions based on existing dimensions.
Until you fully understand their functions, the definitions aren’t very helpful. Let’s jump right in for a better understanding!
Sets vs. Filters
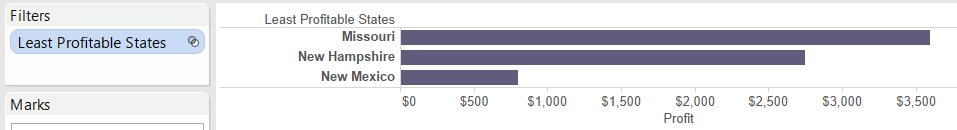
From a managerial perspective, conditional sets are useful for seeing a dynamic representation that may change over time. For instance, if the Vice President is only concerned with the lowest performing states, the following would be applicable:
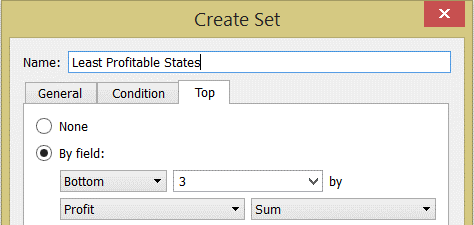
Using this set on the Rows shelf, our visualization dynamically shows only the bottom three states according to Total Profit. If the data changes, and Missouri, New Hampshire or New Mexico are no longer the three least profitable states, the view will adjust accordingly.
You may be wondering why the viz couldn’t just be filtered dynamically instead? The answer is: it could be. However, filters only apply to the current worksheet. Sets can be used again and again throughout the workbook. Since sets become part of the metadata, any workbook connected through that Saved Data Source (or .tds file) can also utilize its functionality. Using sets maintains consistency and saves time. They can also be combined to create an even more specific subset of the data.
What About Groups?
Consider this scenario: Nick is a regional manager and is only concerned with his territory’s states. He’d like to see how his states compare to the rest of the country. In this situation, a visual group provides a better representation.
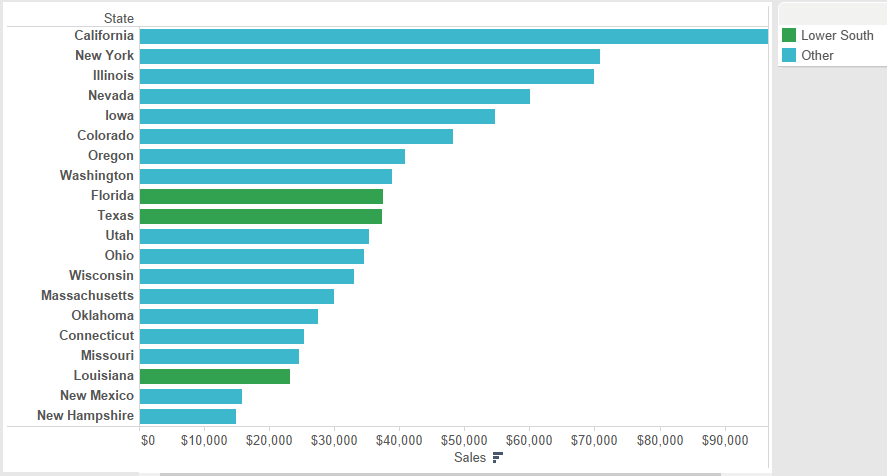
That’s great! Nick can see that Louisiana’s sales are suffering while sales in Texas and Florida rank much higher. The curve ball happens whenever the company decides to start selling in Mississippi, which also falls under Nick’s territory. Unless the group is manually changed, sales in Mississippi will fall under the Other category. An alternate solution to this problem involves changing the underlying data. Adding an additional column named Territory replaces the need for groups in State.
Having control over your Tableau visualizations is an important step in providing valuable information. Here at InterWorks, we’re dedicated to providing useful tips to send you down the road to success!