

Chances are, several people have the same questions about Tableau as you do. The Questions from Tableau Training series spotlights these questions and provides answers. Questions are pulled straight from InterWorks’ Tableau training classes. You can check out the full list of posts on the Questions from Tableau Training blog channel.

As I travel the country spreading #DataVision, there are a few questions that repeatedly pop up in trainings. Today, I’ve decided to tackle a few of the most frequently asked questions to help our efficiency in Tableau.
Q: How do I create custom continuous color palettes?
- Change the TYPE from Regular to either Sequential or Diverging. You can choose multiple colors for Sequential but only a starting and ending color for Diverging.
- For an easier way to create color palettes, check out the Color Tool from InterWorks. Color Tool for Tableau is a free, automated application that lets you create custom color palettes for Tableau with minimal effort.
- You may also be interested in learning more about sequential and diverging color palettes here.
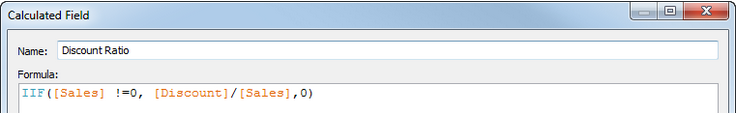
Q: How do I handle a “divide by zero” situation in Tableau?
- Use the IIF function. The function “IIF(test, then, else, [unknown])” asks for four pieces:
- TEST = What are you trying to evaluate?
- THEN = What is the outcome if it’s true?
- ELSE = What is the outcome if it’s false?
- UNKNOWN = What is the outcome if it’s neither true nor false? (This section is optional and usually treated as a null value.)
- Tableau’s Online Help provides the following example to avoid dividing by zero when creating the Discount Ratio:
Q: How do I see an individual, distinct list of all members of a measure?
- Use the measure somewhere in your view (typically the Rows shelf).
- Right-click on the measure active field and choose Dimension.
- Right-click on the measure active field and choose Discrete.
Q: How do I create a dynamic date band controlled by a reference line? For example, how do I add three months to a specified reference date?
- Right-click an axis to create a reference band.
- For the minimum value, create a new parameter with a range of values from your date field.
- For the maximum value, create a calculated field using the DATEADD function (e.g. DATEADD(‘month’,3,[Min Value Parameter]).
- Be sure to bring the calculated field into the Detail button on your Marks card so that its values are available in the reference band.
- Right-click on your [Min Value Parameter] field and select Show Parameter Control, giving users the ability to make the reference line dynamic.
Q: Why doesn’t Tableau recognize all of my fields for an incremental refresh in a data extract?
- The field must be an integer (18 digits long), date, or date/time, and it must be unique to be used as an increment key.
Q: How do I show the entire dimension label without manually adjusting the column width?
- CTRL+Up or CTRL+SHIFT+B makes the cells taller/larger and wraps the continuous text to the next line.
Q: Is there a keyboard shortcut for creating a new calculated field?
- ALT+A+C
Q: What is Tableau’s starting, zero or epoch date for calculations?
- 1/1/1900
- If you need to convert a column to a specified epoch, use this formula: DATETIME(DATEADD(‘second’, INT([Name of Date Column]), #1900-01-01#)), with the numbers between ## representing the specified epoch. Many thanks to Michael Treadwell for this great response.
Q: Why didn’t my Tableau Data Extract ask me to save to a file location?
- “Honey Badger and TWBX don’t care (where the extract goes, because it’s really going into the ZIP folder from temp)!” – James Wright
At InterWorks, we love to tackle challenges. If you have any additional questions, please feel free to use the comment section below or contact us.
The Latest
-

Kickstarting Data Innovation in Healthcare
18 April, 2024