
So, earlier, you created a great report showing sales for the month and published it out to the server. The next month, your manager comes back and complains that the report is set to show last month’s data. Why doesn’t the report just update to the most recent month when the extract is refreshed?
This a familiar topic in the Tableau community, and you can find some of the many different workarounds people have come up with here and here.
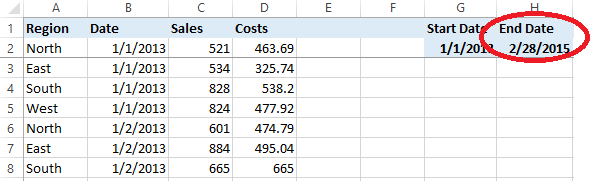
Below is an example of what I like to think is one of the simpler workarounds available. Download the attached files and update the end date in the Excel file to test it out. This solution will not meet the needs of every possible use case, and it does not give you a familiar drop-down filter to select dates from. Feel free to comment with the workaround to this problem that you prefer.
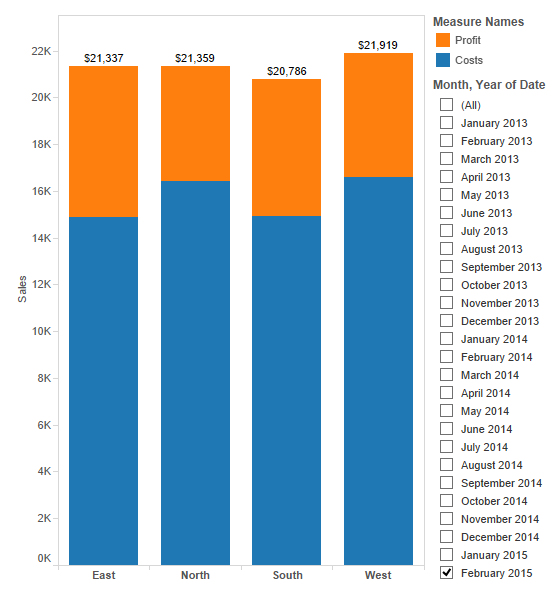
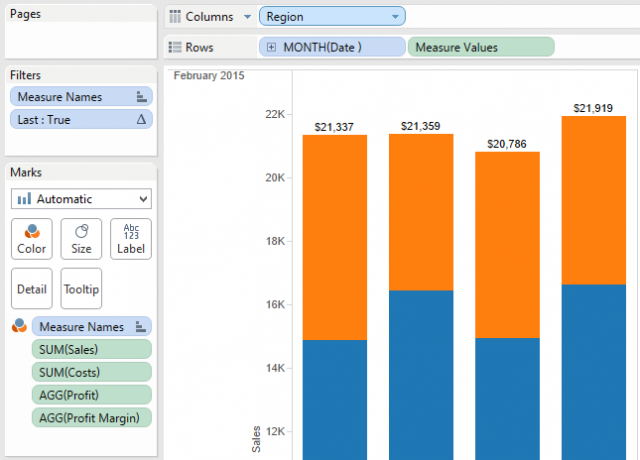
Below is an image of the worksheet that I want to have updated when the extract is refreshed. Currently, the date range is set by a discrete filter on month and year:
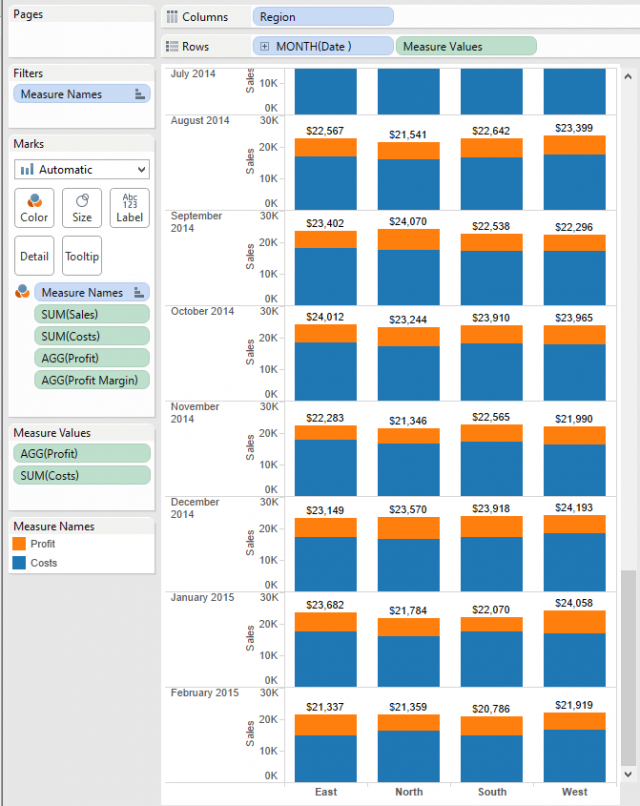
First, in the worksheet, add the date variable to the Rows shelf, set the display level to show the date part you need in discrete format and remove the date filter. In this example, I am using the month date part so the chart is now displayed for each month.
Next, create a calculated field with the formula LAST()=0 to filter out all but the most recent month with the default table calculation set to run off of the date variable.
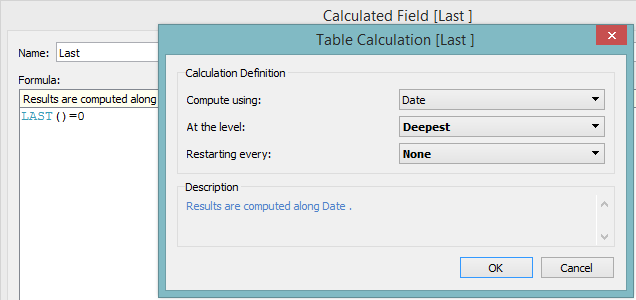
Add this new variable as a filter set to True. If this does not filter out all but the most recent month, go back and adjust the table calculation.
The worksheet now automatically updates to the most recent month in the extract when opened, but your manager also wants the option to review historical sales for the same month last year. If you add in a discrete date filter now, it will lock the worksheet to the month currently selected when the extract is refreshed. To maintain the automatic updates, add the date variable as a Filter > Range of dates > Special > All dates. Now, the table will update to the most recent date inside of the date filters range.
![Filter Field [Date]](/wp-content/uploads/sites/default/files/SetDash5.png)
![Filter [Date]](/wp-content/uploads/sites/default/files/SetDash6.png)
*** DISCLAIMER (Read this next paragraph closely or you will be doomed to failure)
Once the date range has been adjusted in the filter, the worksheet will no longer update to the most recent date when opened. Before saving a file with this kind of filter, always edit the filter and check that it is set to Special > All dates. Similarly custom views saved on Tableau Server with the date range adjusted will not update when the extract is refreshed but the original view will.
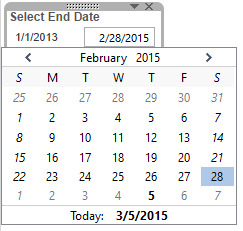
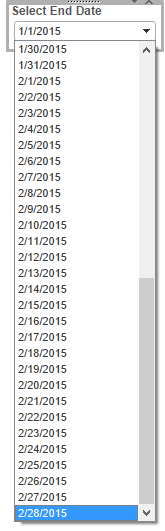
Now, your manager can use the slider, type in the date or click on the date and use the calendar to adjust the time period shown in the chart. The date filter can be customized to hide the slider or if users only need to see the results as month to date the start date can be hidden by a blank text box to clean up the display. The hard part is convincing the manager that entering a date or selecting it from a calendar is easier than scrolling through a giant drop-down list of every day in the last few years.
Calendar
Drop-Down
Attached below is a zip file containing the workbook used in this post and an Excel file that generates data for the workbook. To test that the month displayed in the workbook updates automatically, open up the Excel file, change the End Date and save the file.

Now, when the workbook is opened, it will update to the most recent month. If the workbook is already open, go to a worksheet, right-click on the data source and select Refresh. This will not work if the date filter was adjusted before the refresh or the file was saved after the date filter was adjusted.
The Latest
-

PYD129 – Tableau Conference History with Dan Murray
23 April, 2024