Visualizing 7 Years of Movement on the Gartner BI Magic Quadrant

Data

Visualizing 7 Years of Movement on the Gartner BI Magic Quadrant

Gartner recently released their annual BI Magic Quadrant, which shows the top players in the BI space and ranks them in relation to each other. InterWorks partner Tableau Software is perennially in the Leader category, and this year is no exception. In fact, both Tableau and Microsoft Power BI greatly outpaced others in the market. You can get the full report from Tableau here.

Rankings Over Time in Tableau

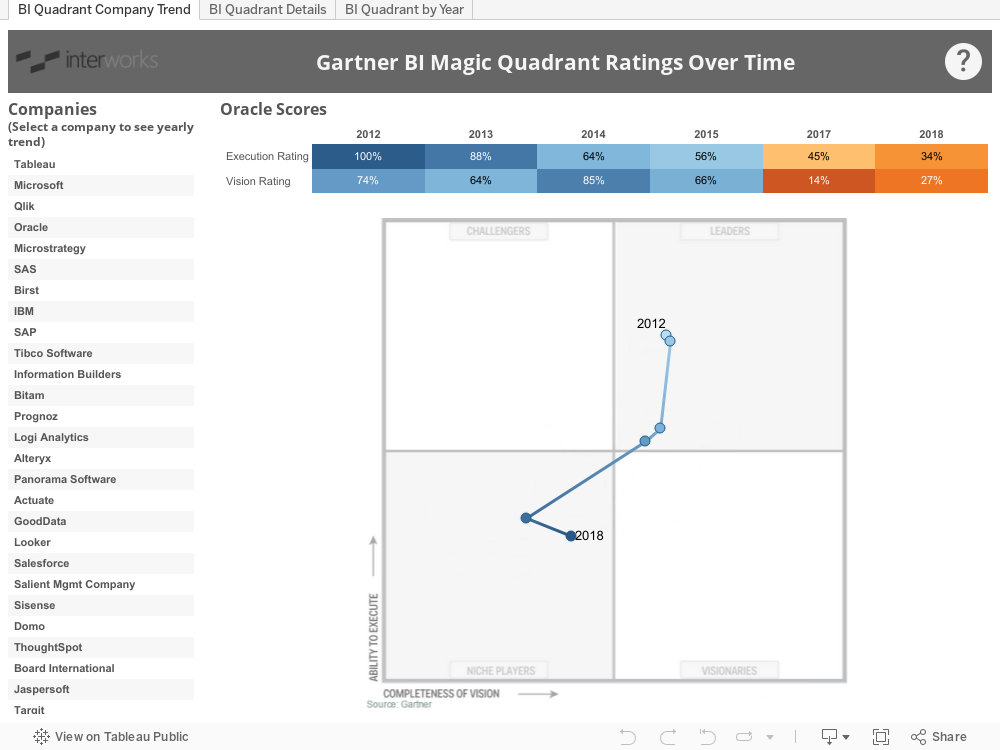
While the Magic Quadrant does a good job of evaluating platforms on their ability to execute and their completion of vision, it’s important to take any rankings with a grain of salt. It’s also important to take into account ranking history over multiple years. This inspired me to use Tableau to create a dashboard showing the history of BI Magic Quadrant rankings for the past seven years. You can explore the dashboard below. Be sure to click through the different tabs to see the rankings broken down in different ways.

More About the Author

Kent Sloan

Services Lead
Say Less: How To Ensure Your Tooltips Add Value We’ve all done it. We’ve completely ignored the warning label. You know, the one we probably see everyday: CAUTION: Contents Hot We ...
Visualizing the 2022 Gartner BI Magic Quadrant in Tableau Gartner has released its annual Magic Quadrant report for 2022, and, per tradition, I’ve visualized the report in Tableau. Each ...

See more from this author →

InterWorks uses cookies to allow us to better understand how the site is used. By continuing to use this site, you consent to this policy. Review Policy OK

×

Interworks GmbH
Ratinger Straße 9
40213 Düsseldorf
Germany
Geschäftsführer: Mel Stephenson

Kontaktaufnahme: markus@interworks.eu
Telefon: +49 (0)211 5408 5301

Amtsgericht Düsseldorf HRB 79752
UstldNr: DE 313 353 072

×

Love our blog? You should see our emails. Sign up for our newsletter!