Today, I got a really interesting request to create a Venn diagram in Tableau that showed the overlap in customer segments. I had seen the 3 Way Venn done by Rob Austin here at InterWorks; however, I needed something that allowed me to select the intersections of the diagram to filter the view. Googling every possible combination of “Venn Diagram in Tableau” didn’t turn up any results, so I knew a solution would be a bit of a challenge. I ended up coming up with a solution using a couple other tools besides Tableau.
Using Illustrator and Alteryx to Create Polygons
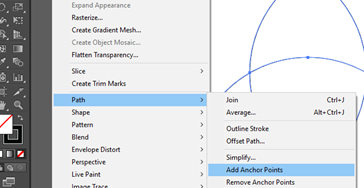
I started by drawing the Venn diagram using Adobe Illustrator. I first created the overlapping shapes using the pathfinder tool. Next, I added a lot of points on my circle so that the curved edges would look smooth in Tableau. Illustrator uses vector files that use Bezier curves to draw a smooth line in between points, but a polygon in Tableau can only draw straight lines between coordinates. Thankfully you can add more points in Illustrator by selecting the shapes then Object Menu > Paths > Add Anchor Points.
Each time you add anchor points, it essentially doubles the number of points on the shape. I found that doing this seven times created a high enough resolution to use in Tableau. Any more, and the amount of points would cause the viz to slow down, any less and the image looked choppy.
After adding points, I used this technique by Brian Prestige to grab the coordinates of the points from the Illustrator file and format them to use as polygons in Tableau. I used an Alteryx module I modeled after his to format the data and repeated the process for a 2 circle Venn diagram and a 4 Circle Euler Diagram. A true 4 set Venn diagram (with each possible intersection) looks pretty strange, so I opted for the more basic option despite its limitations.
Adding Labels with More Coordinates
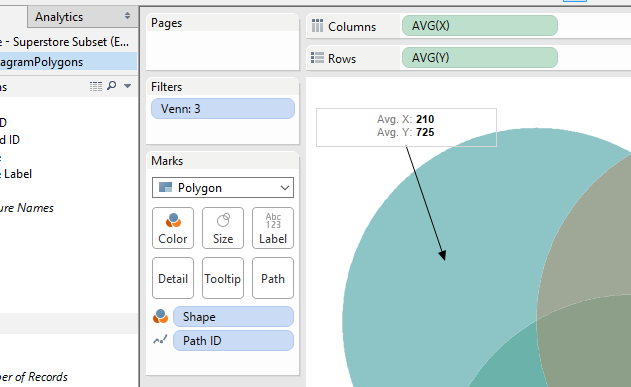
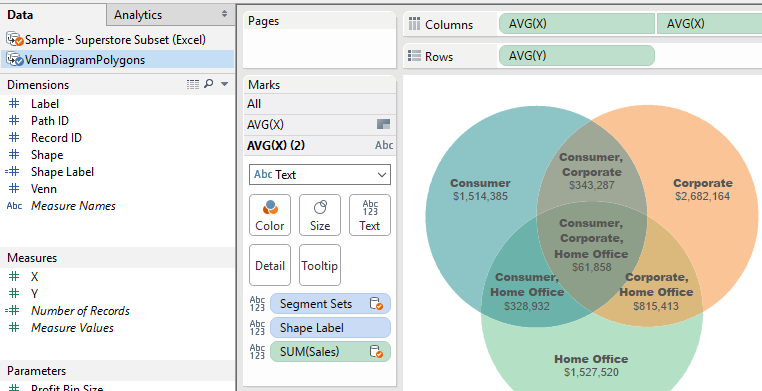
Once I tested the polygons in Tableau, I used annotations to get coordinates for the mark labels. Polygon marks in Tableau don’t allow for labels so you have to use a dual axis chart to do this. Alan Eldridge outlines a similar concept to generate labels on a map. Once I found the coordinates, I used Alteryx to union the label data with my polygon data set I had already prepared.
To Blend or Not to Blend
The solution I came up with uses a blended view with the polygon data set as the primary data set. I found this to work just fine even though I ended up creating a couple extra calculated fields to use as linking fields. You could also union the polygon data with the actual data set and get a similar result.
More Possibilities?
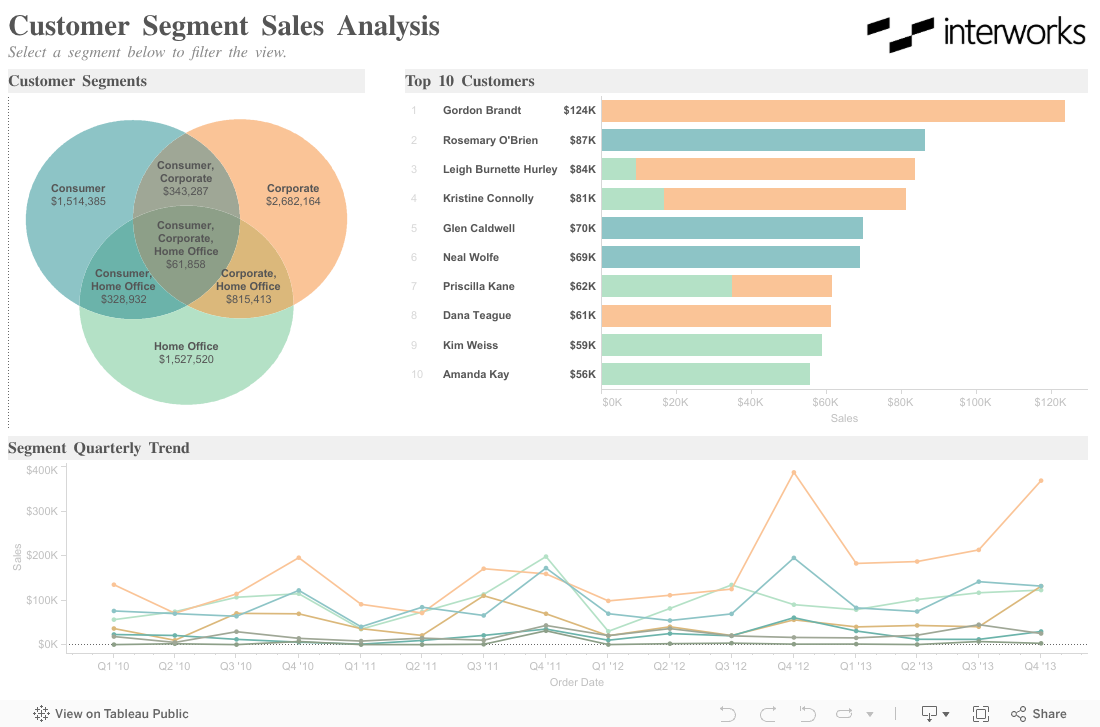
This exercise got me thinking that more viz types could be possible in Tableau using this method. Can you think of any other visualizations that could be built using this method? Let us know, and maybe we will give it a shot! In the meantime, check out the viz below or the attached workbook and see if you can build your own Venn diagram visualization in Tableau.