Questions from Tableau Training: Colouring Specific Columns and Rows in a Crosstab

Data

Questions from Tableau Training: Colouring Specific Columns and Rows in a Crosstab

by Mavis Liu
//

Our Certified Tableau Trainers are asked a myriad of questions each day. In this series, they share some answers.

This question came up from one of the attendees where I was leading a Tableau Workshop and it’s not the first time either! After showing a demo of creating a crosstab, they asked:

“Can we colour a specific column or row in a crosstab?”

So, here it is …

How to Colour Your Crosstab

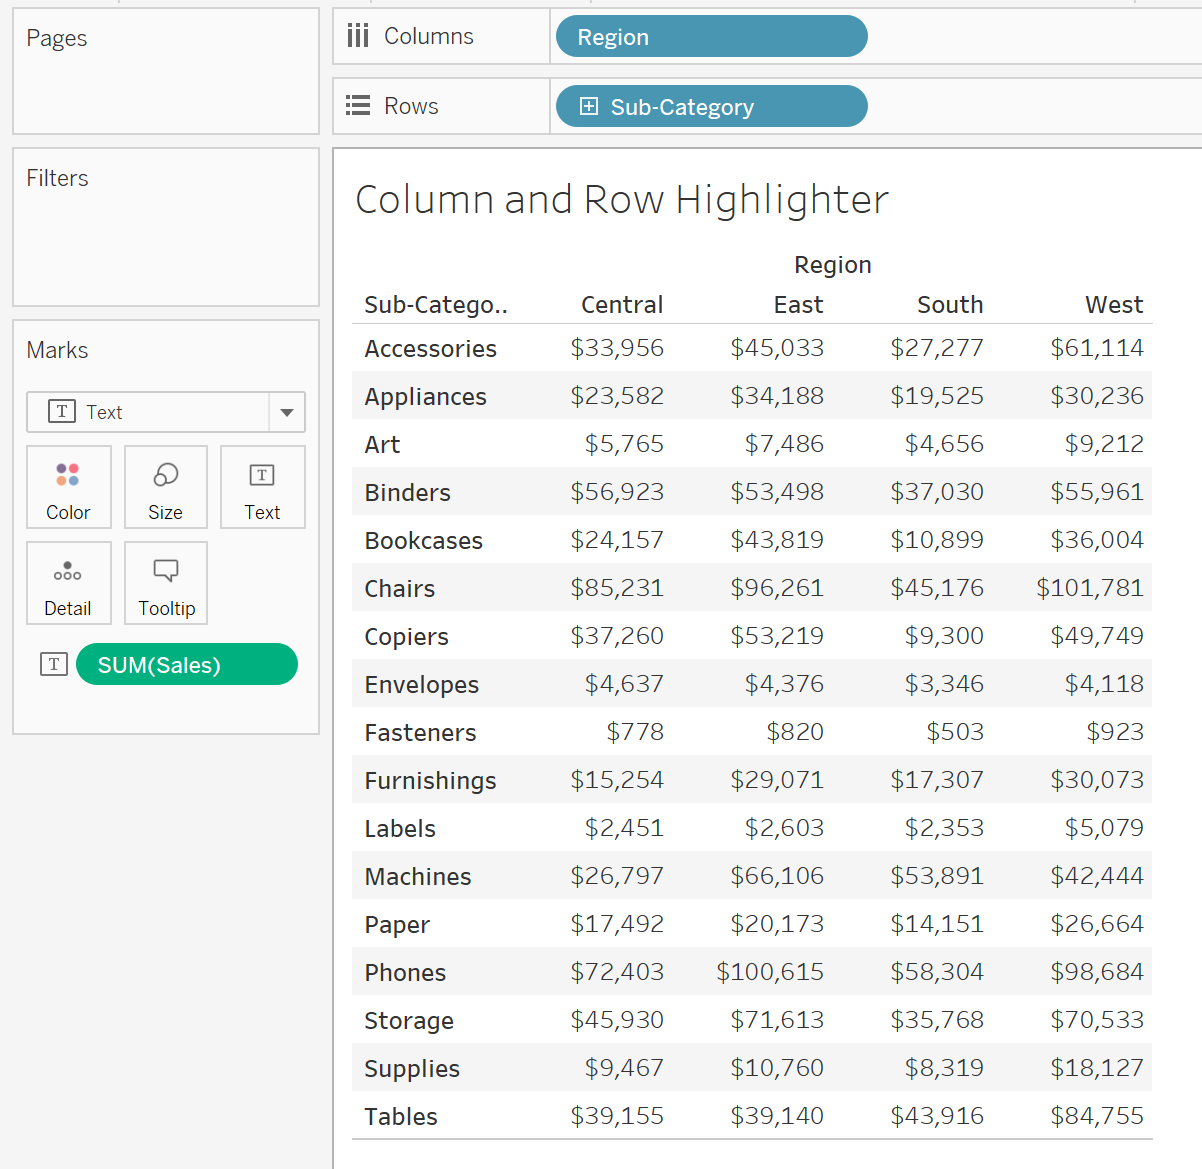
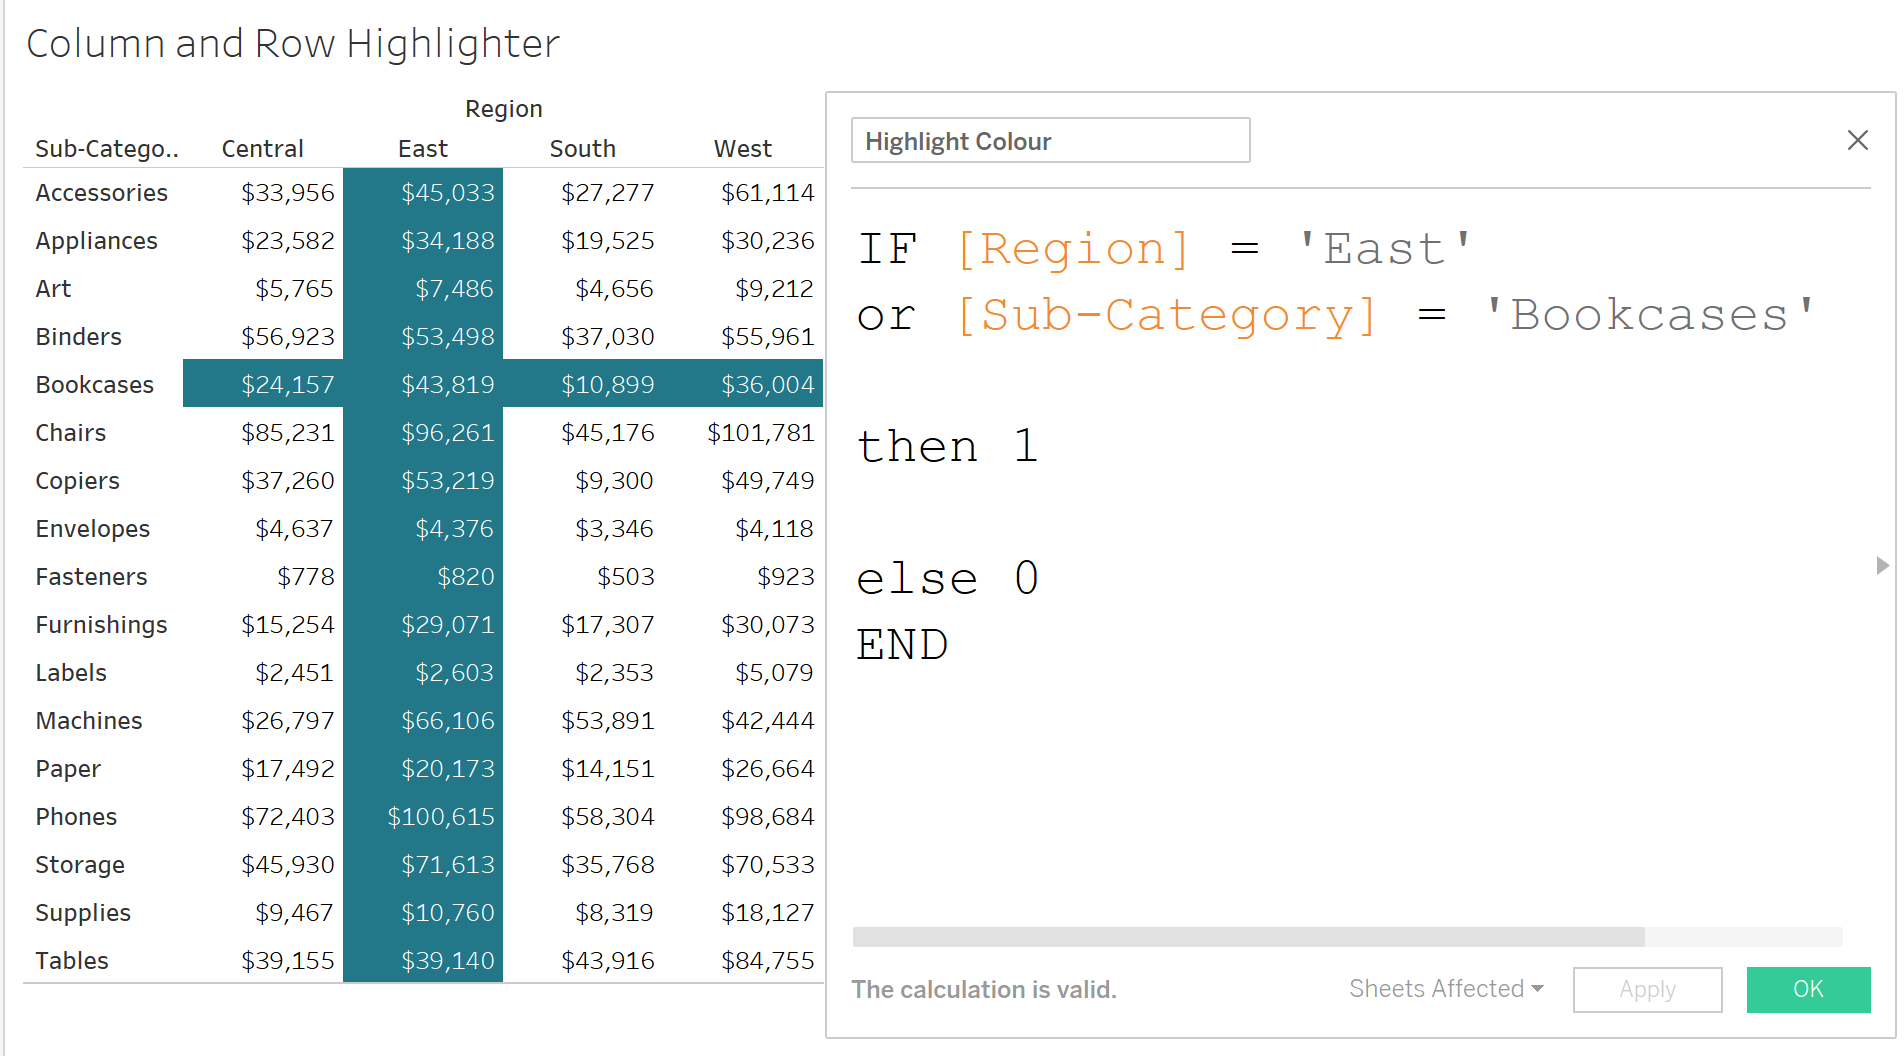
Below we have a crosstab, where it shows sales by the region and sub-category. The attendees wanted to know if you could highlight a specific region as an end user may be interested in that particular area.

Crosstab in Tableau

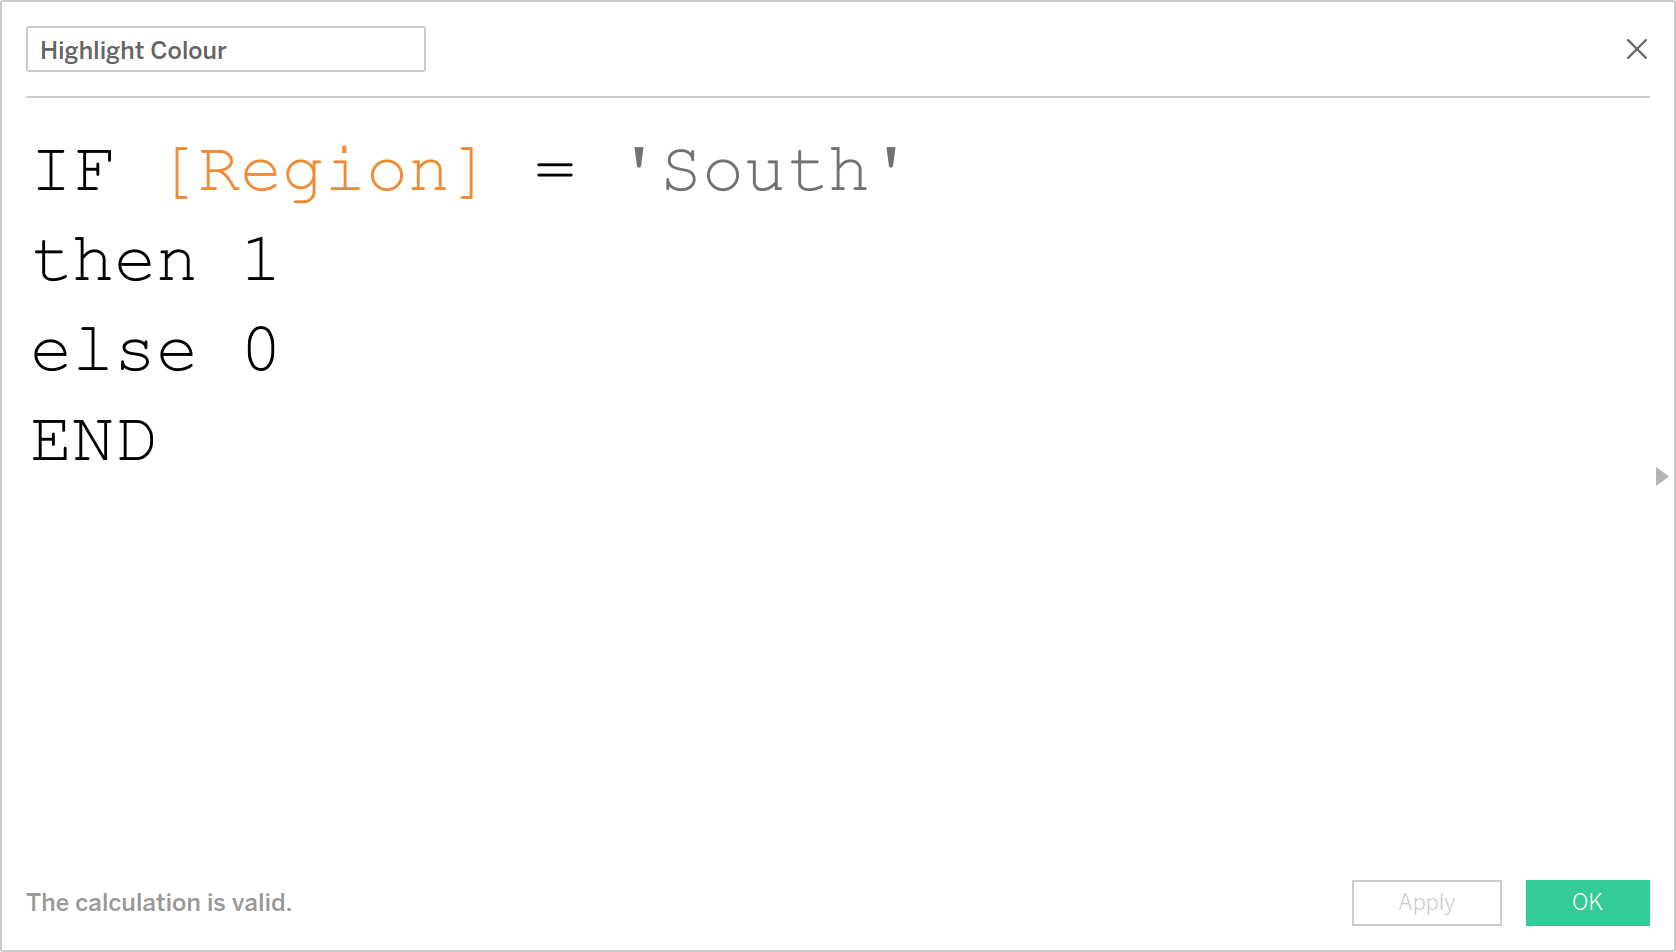
Formatting options do not allow you to choose a specific column or row in the crosstab, so we would use a calculation in this case. As we would like to colour the Region dimension, we should specify the dimension within the calculation. My below calculation assigns a value of 1 whenever the region is South; any other region would have a 0 assigned:

Highlight Colour calculation

By bringing this field onto Color on the Marks card, you’ll see a colour legend come up:

Colour legend

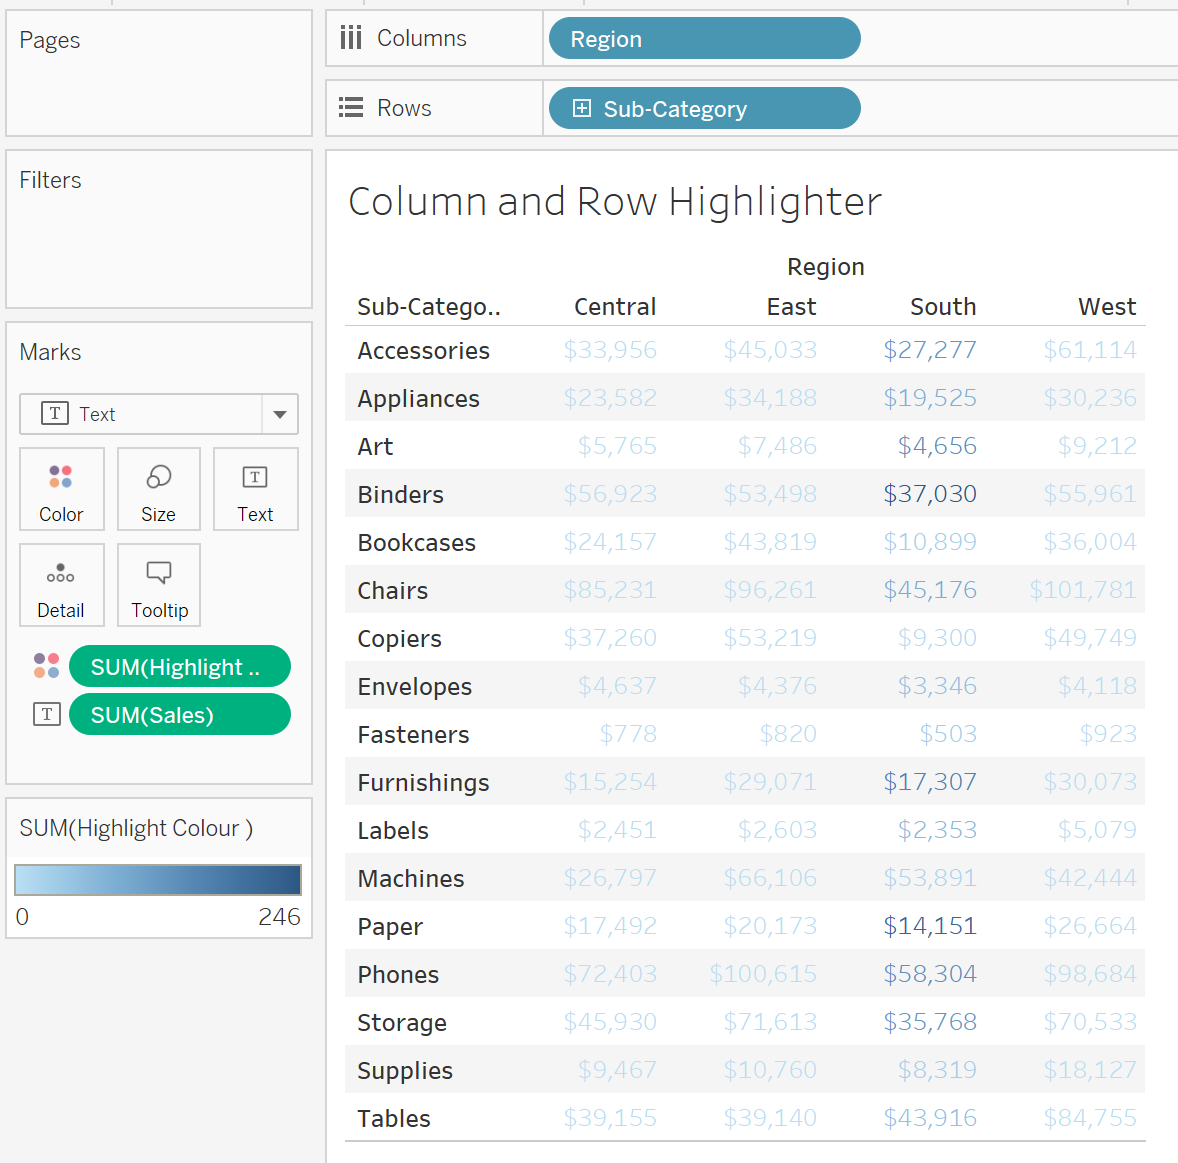
By default, it will colour the text and aggregate this field by SUM. It is currently counting how many records there are for the South region in every sub category. This isn’t an issue because we know that anything identified as 1 and above is in the South region. If you would like to, you can change this aggregation to min, max, median or average. Ultimately, it doesn’t matter because it will return values that are either 0 or 1 and above.

Click on Color on the Marks card, change to Custom Diverging and put a white colour for the left option, then a darker colour on the right. Make it into a two-stepped colour, then click on the Advanced button and fix it to start from 0 and ending at 1. This means that anything identified as 1 or above will be the darker colour; anything under 1 will be white. Click OK:

Edit Colors

Finally, on the Marks card change the type to Square so that the whole cell is coloured:

Whole cell coloured


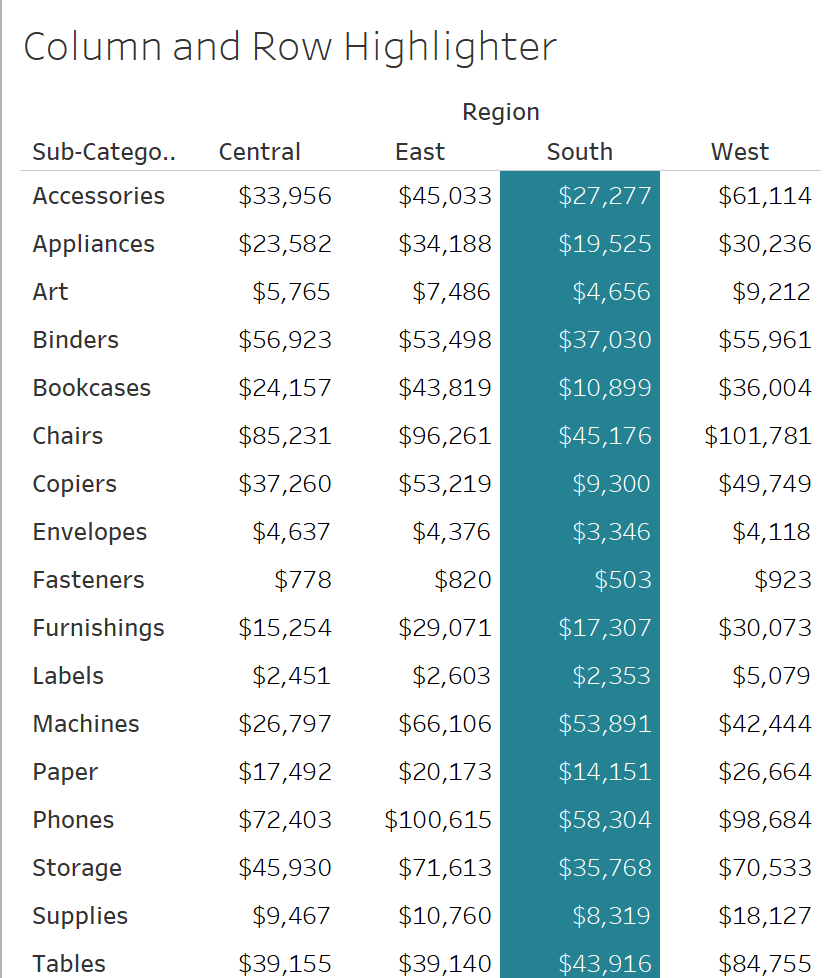
In our calculation, we specifically asked for the return values to be 1 or 0, which would make it into a continuous field. Making it into a continuous field allows us to have the filled square option that you see above.

We don’t have to stop there. We can highlight more than one column or more than one row. We could even try a combination of both! Just like in my example below, all you have to do is update the calculation and specify the requirements of another dimension. In my calculation, I want the view to colour the row when Sub-category is Bookcases:

Conditional row colouring

In fact, why not make this even more flexible by adding in parameters so that the end user has the control? We can create the first parameter for Region, have it as a string type and populate the list by using Add from Field > Region:

Add from Field Region

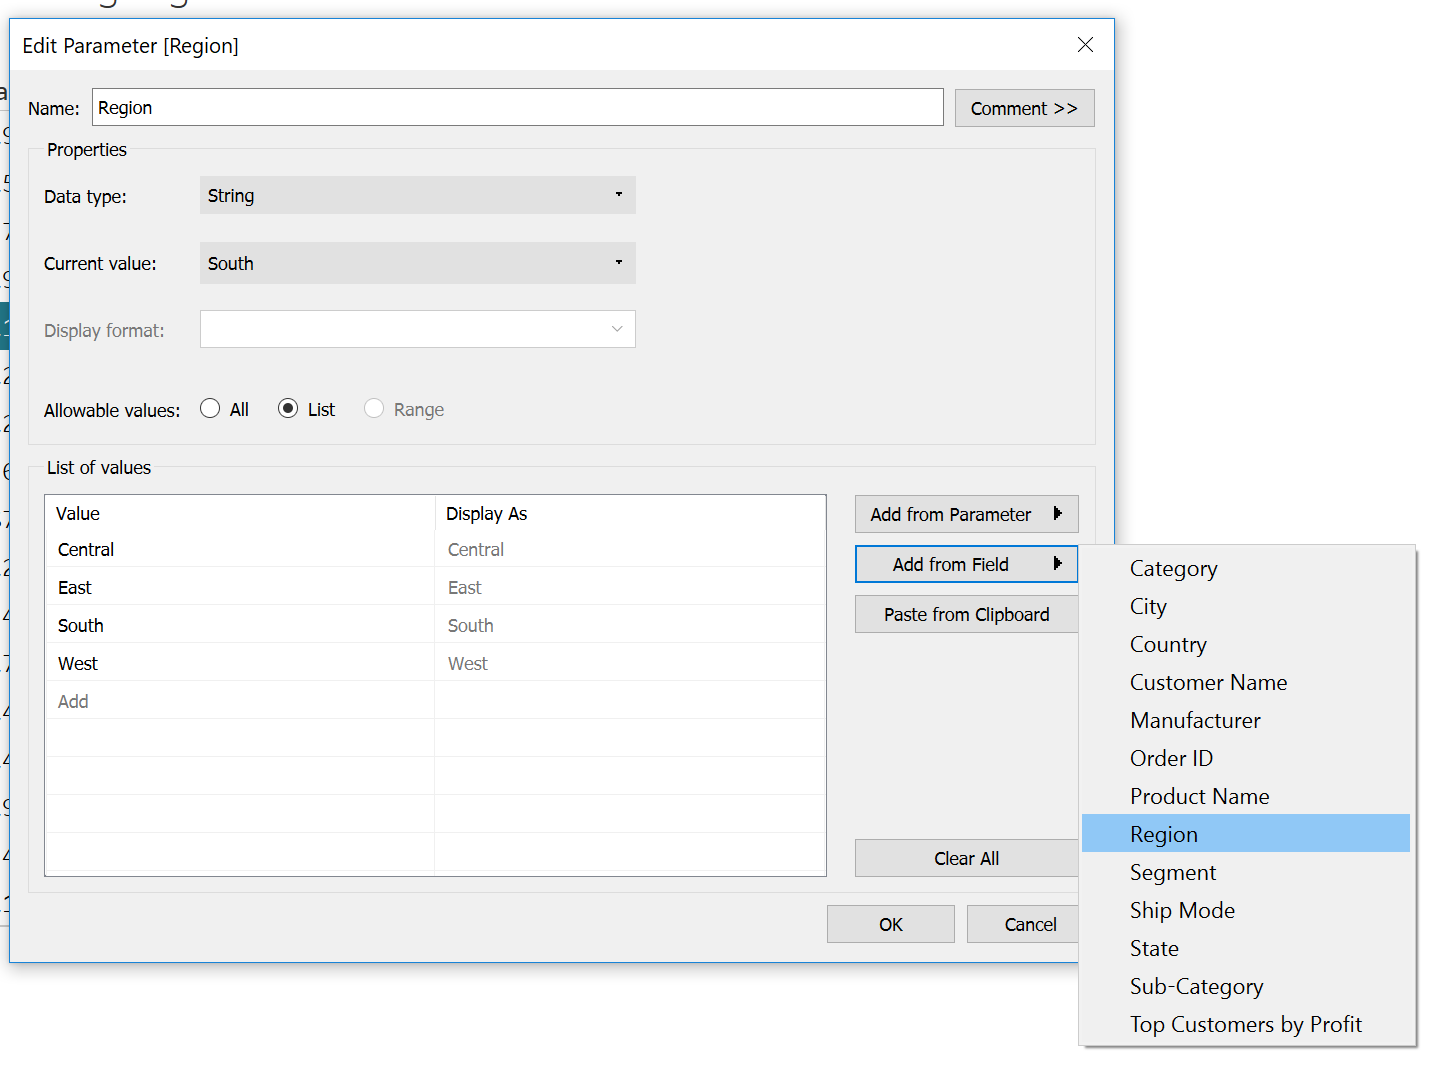
Next, we repeat the steps and do the same thing for Sub-Category. Now that we have our two parameters, we can substitute these into our original calculation:

Repeat steps


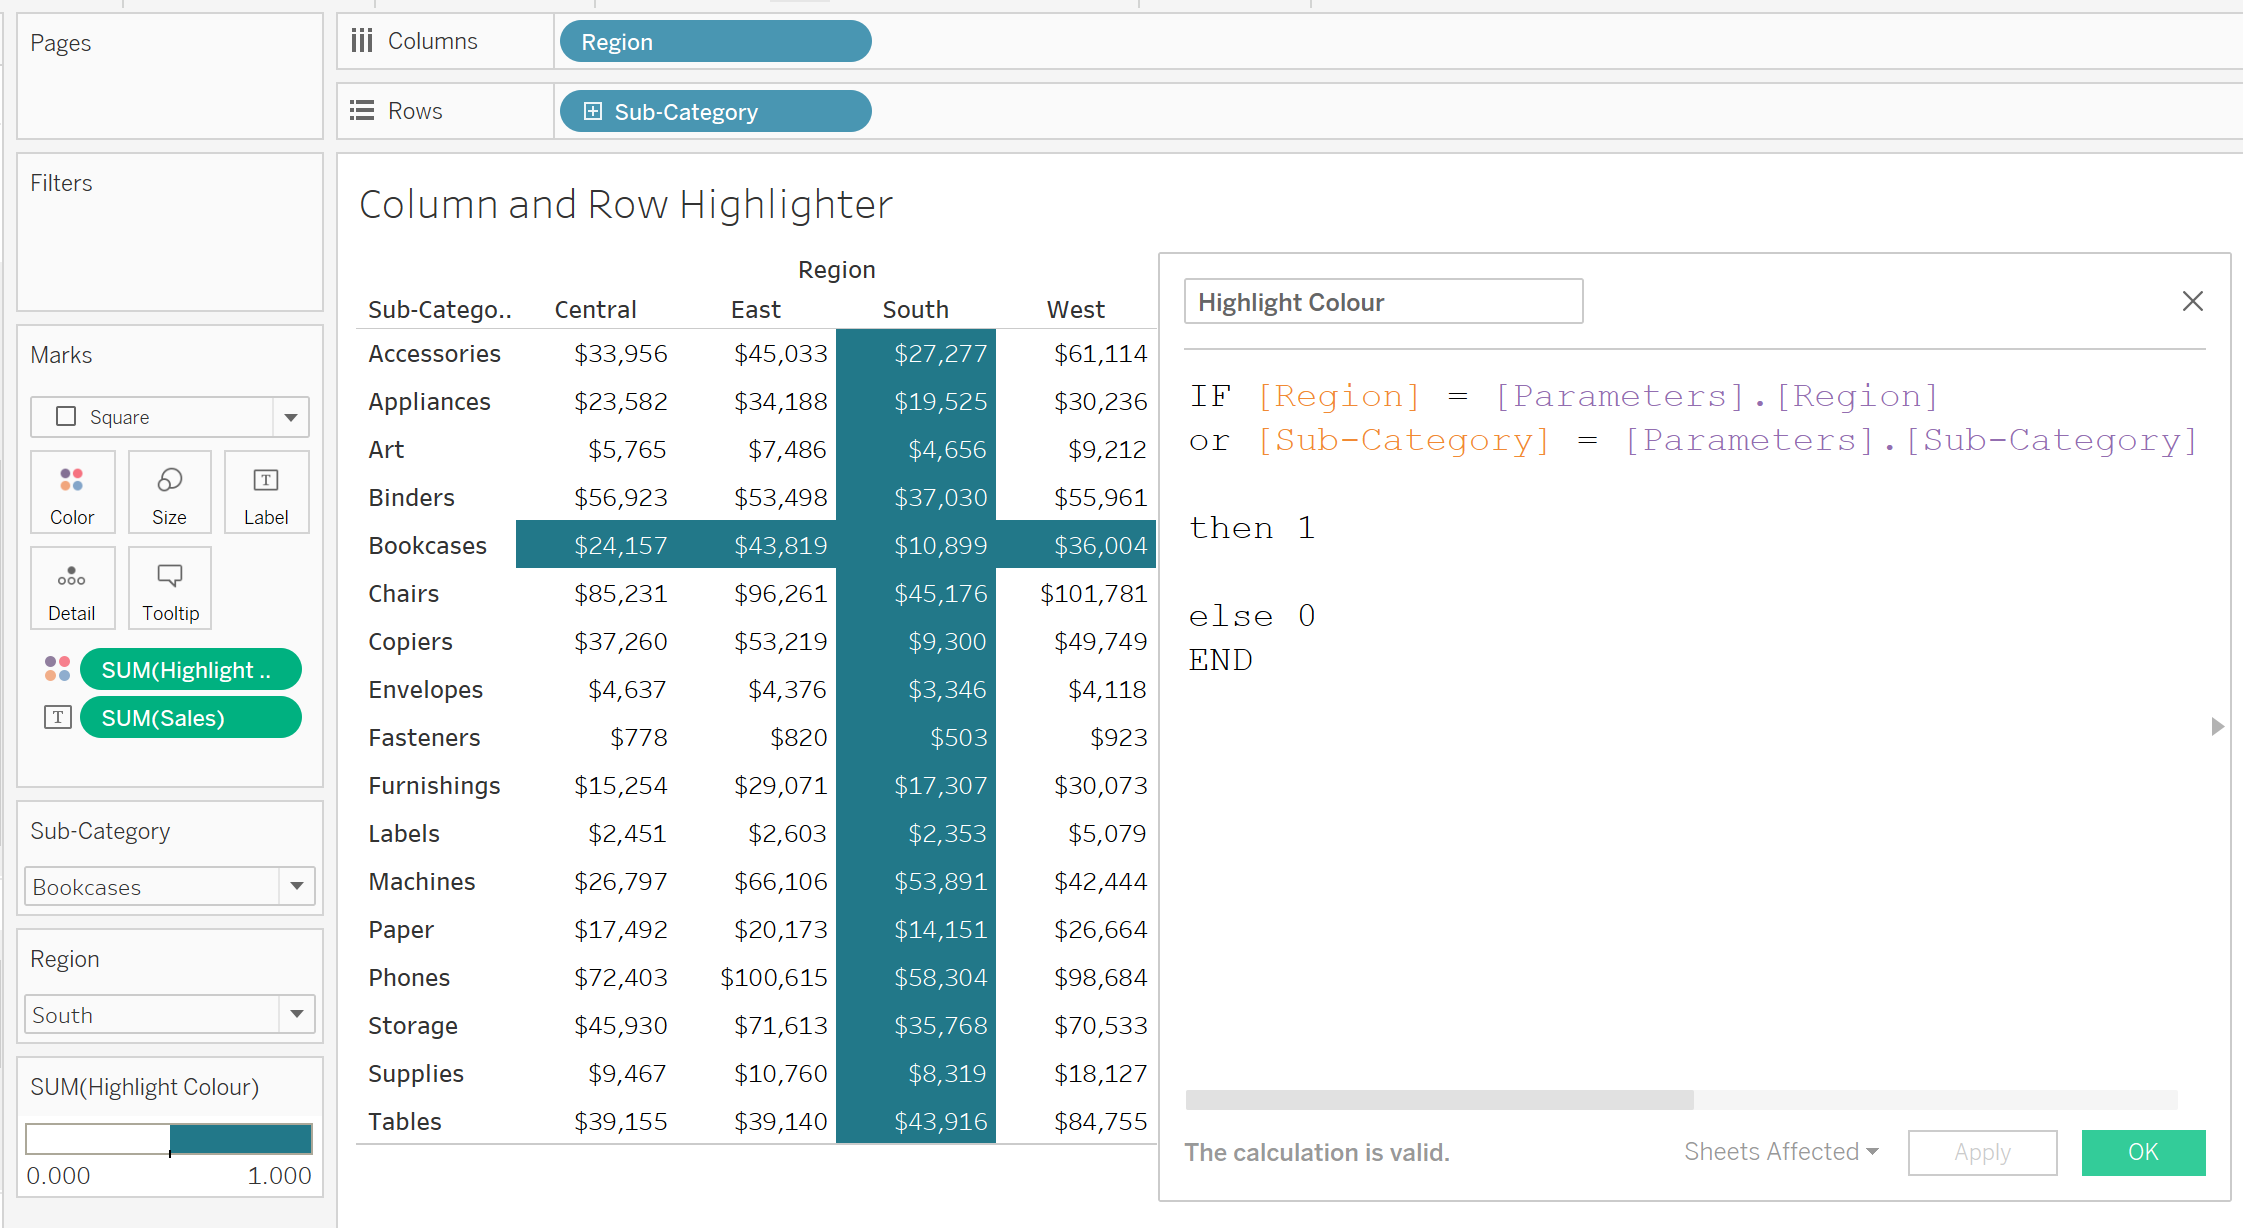
So, the end user can now use the parameters to control which dimensions they want highlighted in the crosstab. If you would like to implement this in your Tableau reports, you can download and use my sample workbook below to help you. The data source I’m using is the Sample Superstore, which is available from the Saved Data Sources in Tableau Desktop.

Want More Questions from Tableau Training

  1. Questions from Tableau Training: Quick Filter Interaction
  2. Questions from Tableau Training: Labeling with Table Calculations
  3. Questions from Tableau Training: Speeding Up Presentation Views when Using Tableau
  4. Questions from Tableau Training: Dashboard Actions
  5. Questions from Tableau Training: Business Day Calculations
  6. Questions from Tableau Training: Adding Gaps Between Bars
  7. Questions from Tableau Training: When to Pivot Data in Tableau
  8. Questions from Tableau Training: Adding Conditional Formatting
  9. Questions from Tableau Training: Setting Weekday Start
  10. Questions from Tableau Training: How Do ZIP Codes Work in Tableau?
  11. Questions from Tableau Training: The Small Grey Bar Within a Quick Filter
  12. Questions from Tableau Training: Matching Mark Color
  13. Questions from Tableau Training: Showing the Null Indicator
  14. Questions from Tableau Training: Can I Manually Set the Colors of a Stepped Gradient?
  15. Questions from Tableau Training: How Can I Get Box Plot Data into a Crosstab?
  16. Questions from Tableau Training: How Do I Clear a Worksheet? Make a Copy?
  17. Questions from Tableau Training: Opening URL Actions Inside of a Dashboard
  18. Questions from Tableau Training: Can I Move Mark Labels?
  19. Questions from Tableau Training: How Can I Use My Current Report to Create a Viz?
  20. Questions from Tableau Training: Can I Create Text Hyperlinks on a Dashboard?
  21. Questions from Tableau Training: How Can I Transform My Crosstab into a Flat List?
  22. Questions from Tableau Training: Labeling the Top N
  23. Questions from Tableau Training: How Can I Customize Charts with Parameters?
  24. Questions from Tableau Training: Combining Measures into a Single Line
  25. Questions from Tableau Training: How Can I Create Custom Color Palettes?
  26. Questions from Tableau Training: Can a Top N Parameter be Nested Within Other Fields?
  27. Questions from Tableau Training: Conditional Scope on Tableau Calculations
  28. Questions from Tableau Training: Top Ten Plus N
  29. Questions from Tableau Training: Dynamic Label Positioning
  30. Questions from Tableau Training: Using Cross Joins to Solve Active Tickets
  31. Questions from Tableau Training: Top N Highlight Table
  32. Questions from Tableau Training: How to Use Specific Dimensions in Table Calculations
  33. Questions from Tableau Training: Moving Reference Line Labels
  34. Questions from Training: Comparing Metrics for Same Weekday in Previous Year
  35. Questions from Tableau Training: Colouring Specific Columns and Rows in a Crosstab
  36. Questions from Tableau Training: Creating a Custom Legend as a Sheet
  37. Questions from Tableau Training: How Can I Draw a 45-Degree Angle?
  38. Questions from Tableau Training: Down the Aggregation Rabbit Hole
  39. Questions from Tableau Training: Percent Change from Previous Period on a Map
  40. Questions from Tableau Training: Union File Names as Years
  41. Questions from Tableau Training: Conditional Coloring on Sparklines
  42. Questions from Tableau Training: Moving Column Headers to the Top of the View
  43. Questions from Tableau Training: Isolating Rank with Parameters and Calculations

More About the Author

Mavis Liu

Analytics Consultant
Bound for Berlin: InterWorks Awaits Tableau Conference Europe 2019 It’s nearly that time of year again! I am really looking forward to Tableau Conference Europe 2019 this month! Soon, I’ll be flying ...
Travel Made Easy with Tableau Calendar View Planning a holiday can be quite stressful in its own right. However, when I was planning a recent trip to Asia that involved making ...

See more from this author →

InterWorks uses cookies to allow us to better understand how the site is used. By continuing to use this site, you consent to this policy. Review Policy OK

×

Interworks GmbH
Ratinger Straße 9
40213 Düsseldorf
Germany
Geschäftsführer: Mel Stephenson

Kontaktaufnahme: markus@interworks.eu
Telefon: +49 (0)211 5408 5301

Amtsgericht Düsseldorf HRB 79752
UstldNr: DE 313 353 072

×

Love our blog? You should see our emails. Sign up for our newsletter!