
It’s not uncommon for a client to have multiple locations within their organization. When those locations are updated and changing frequently, a flexible locations map page on the client’s website is essential. We’ve implemented several solutions to this challenge. On one end of the spectrum, we’ve created custom map backgrounds and JavaScript to plot points and popups for the map. At the other, we’ve used the Drupal GMap module and Views to create a map element with the standard controls that website visitors are accustomed to using. Both solutions lack flexibility in terms of the design of the map and the ease of content management for the end user.
A Hybrid Solution: OpenLayers
OpenLayers is an open source JavaScript library for displaying map data. This library has been implemented for Drupal via the OpenLayers module. The main advantage that this module has over GMap is that you aren’t limited to Google’s map layers and branding. Several map providers are supported by OpenLayers, giving you more flexibility in the presentation of the map colors and elements. It looks like there are options for developing completely custom map layers via UML, but that won’t be covered in this post.
The Scenario
A client needs a map, zoomed in on their area of the country, with a dozen location points. The client would like for website visitors to view contact information for a location when a point is clicked, along with the option to view more information about the location. The map display should have the ability to zoom and scroll within the content, and the website administrator should have the option to customize the “Base Layer” that is displayed under the points.
The Groundwork
For the purposes of this post, I’ll be referencing an implementation of the OpenLayers module within Drupal 7. There are versions of the module for Drupal 6 as well, but several of the terms have changed and the following walkthrough will vary slightly. I’ll be using custom content types that are built into the core of Drupal 7, as well as the powerful Views module. Prior to beginning, I updated the core of my site to 7.10 and Views to 7.x-3.0. We’ll be installing and configuring OpenLayers 7.x-2.0-beta1. The module installs like any other Drupal module, so I’ll assume that you’ve completed that step. I’ve opted to download the OpenLayers library to my sites/all/libraries folder as well, but by default the module uses a hosted option so this isn’t necessary. The only additional module required by OpenLayers is Chaos Tools, but that’s a requirement of Views as well. Enable the OpenLayers, OpenLayers UI, and OpenLayers Views modules and let’s get started!
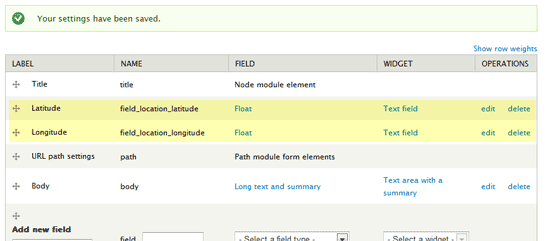
Location: A New Content Type
I’m going to create a custom content type named “Location”. These pages will be used to gather all of the information about a single location. For the time being, I’m only going to add two additional fields: latitude and longitude. I set both of these fields to float (we’ll be using decimal values) and made them required so that content administrators can’t create a new location without entering the coordinates for the map. We’ll feed these values to the OpenLayers module so that it can plot our points.
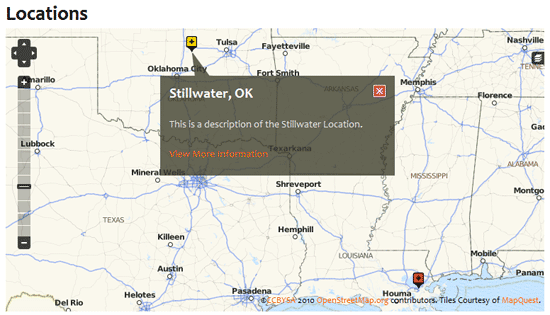
There are several websites that will convert a zip code to latitude and longitude, but none worth recommending. I looked up the coordinates for two locations to use as examples: Stillwater, OK and New Orleans, LA. I created two new locations pages so I’ll have some content to test with.
Views Does the Heavy Lifting
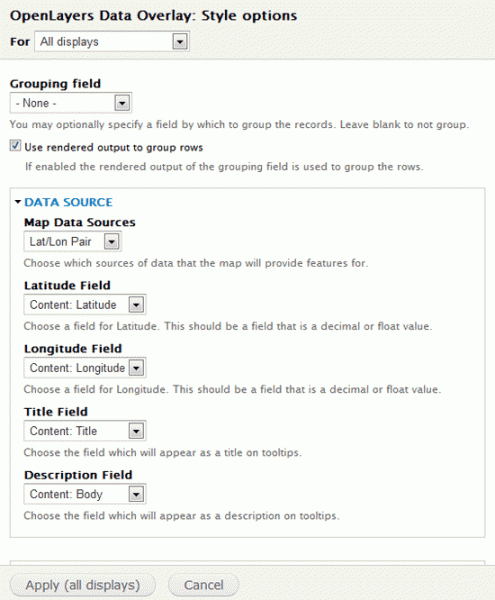
We have a couple of locations saved now, but here’s the real roadblock: How do we get Drupal to plot our points on a map? This is where it all starts coming together. Views combines the new content type with the OpenLayers module and does all of the plotting for us, and even replots the points as the map is scaled and/or dragged! We’ll need two views: one that plots the points and one that displays the map layer. I’m actually going to use a single view, with multiple displays. To start with, I’m going to create a view of only location pages with OpenLayers Map selected as the display format. I want to disable any pager settings since I’ll want all points displayed at the same time. Once I click save, I’m not going to immediately do anything with the page display that gets created. I’ll save that for a later step. Instead, I’m going to create a new display of the type “OpenLayers Data Overlay”. I’m going to change the view display format to “OpenLayers Data Overlay” as well, so that I can select the fields that the OpenLayers module will use to plot points. In the fields section, I’m going to add Latitude, Longitude, Content Title, and Content Body.
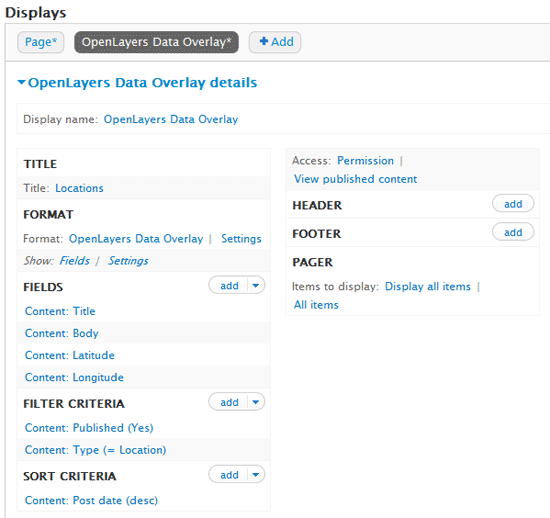
Once these fields are added, you can select where OpenLayers pulls the latitude and longitude values from in the view display’s format settings. Select the correct field values and save your view. We’ll come back to it shortly.
Configure OpenLayers
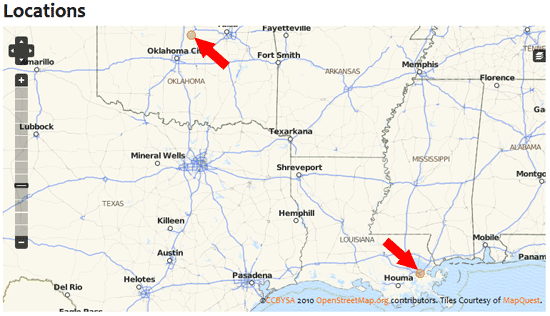
We need to setup a custom map for our view to use when plotting points. Pulling up the “Maps” tab on the OpenLayers page will allow you to clone an existing Map. I’m going to clone the “Default Map” so that we can customize the settings for our needs. It’s important to change the Map Machine Name, Map Title, and Map Description so that it can be differentiated from the other maps. On the “Center & Bounds” tab at the right, we’ll want to set our starting zoom level and centerpoint. The module provides a nice map based interface for setting these, so I’m going to zoom in and pan around until I can see both Stillwater, OK and New Orleans, LA in the map window. I can now see that my centerpoint has been filled in with -94.548330680929, 32.713342504086, and my Zoom Level has been set to 6. These settings will start the map with these parameters any time the page loads. On the Layers & Styles tab, I’m going to check the “ENABLED” and “ACTIVATED” boxes in the “OVERLAY LAYERS” box for my Locations view. Without this, your view won’t display any points. There are several other options that we can customize for this map, but let’s save for now and come back to that later.
Creating the Map Widget
We haven’t seen much in the way of demonstration yet, but here’s where that changes. Let’s go back to the page display that was created for our locations view. The format will likely be “OpenLayers Data Overlay”, since we set that up for our other display. Change that to “OpenLayers Map” and make sure that “This page (override)” is set before you click Apply. We don’t want to change this for every display in our view. In the Format settings page, select our custom map (I called mine “Locations Map”) and click Apply. I had previously specified a path of /locations for my page, so now I should be able to visit that page and see the two locations that I entered displayed on the map widget!
We now have a functioning map that allows us to add points simply by knowing the latitude and longitude. Let’s add some finishing touches.
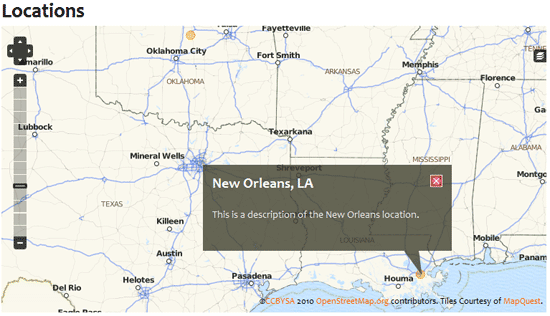
Add a Tooltip Popup
We could simply make the point a link to the full locations page, but maybe we’d like to deliver some quick information to our audience without the need to refresh the entire page. Let’s go back to the settings for our custom OpenLayers map, and click on the “Behaviors” tab. There are several features here, and I would encourage you to investigate them all. For our example, we’ll either want to use “Pop Up for Features” or “Tooltip for Features”. The only difference is when we want to see the popup. If we want users to see it immediately as they mouse over a point, then we’ll want the Tooltip option. If we want users to click on a point to see the popup, we’ll want to select the Pop Up option. I’m going to select the Pop Up option because I want users to click an additional link inside the popup, and that can be difficult to click on if styling for the tooltip isn’t implemented correctly. Once selected, you also need to check the box for the view you are using to display points. Let’s save the map and refresh our locations page. You’ll now see that you can click on the points to get more information.
You can add a link to the full locations page in this popup by simply adding a Content: Link field to the page display of your view. You’ll need to set the “Description Field” in the display settings to “
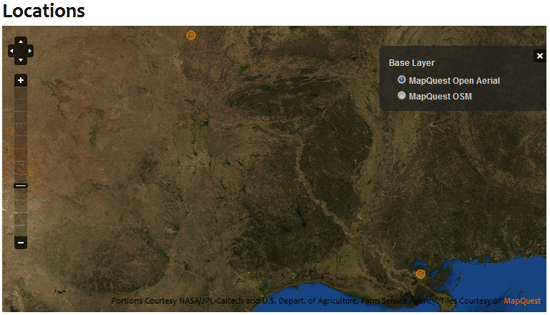
Change the Base Layer
One of the major advantages of using OpenLayers is the ability to change the colors and elements in the map by choosing a different base layer. The base layer is the actual map that lays underneath your location points. The website administrator can set the default base layer that is displayed in the map, as well as additional base layers that are available for the website visitor to change. If we open the custom map that we created in OpenLayers and click on the “Layers & Styles” tab at the left, you’ll see that MapQuest OSM is selected as the default. This is the base layer that will always load initially when the locations page is visited.
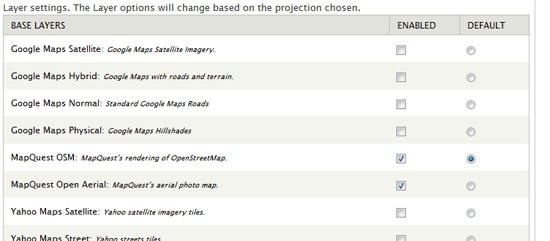
You’ll also notice that two maps are checked as “Enabled”. This adds the base layer to a list that the website visitor can switch between within the map controls.
Customize Your Map Point Graphics
One thing that I’m noticing about my locations map is that the default points tend to get lost. OpenLayers provides the ability to select a different graphic for the point, or upload a custom graphic. You’ll notice that there is a STYLES tab on the OpenLayers settings page that defines several preset point graphics. You can clone any of these preset styles and then customize the graphic. If we edit our custom locations map and click on the “Layers & Styles” tab, we can select a different default style for the points in the map.
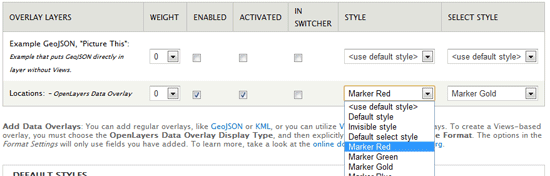
Once we save these settings and refresh our map page, you can see that the point markers have changed.
Conclusion
Creating a locations map that meets a client’s needs will always be challenging. For instances where location information doesn’t change very often, OpenLayers might be overkill. But for most other instances, this module gives you the tools that you need to keep the editing capabilities for the site in the hands of your Drupal site administrators, while maintaining some control over the design, presentation, and functionality of the map interface.
The Latest
-

Kickstarting Data Innovation in Healthcare
18 April, 2024