
Approximately 8.2 million people live within the five boroughs that make up New York City. Every year, thousands of accidents occur due to a multitude of contributing factors. NYPD collects information about each of those accidents and provides it for public use on nycopendata.socrata.com. We decided to explore the crash data to see if there were any underlying trends and relationships that could explain the number of accidents occurring. The data contained over 600,000 observations from July 2012 to July 2015. We chose to exclude August 2015 data, given we didn’t have the full month of data.
Initial Questions + Hypothesis
Before exploring the data, we created a list of questions we wanted to address:
- Is there a relationship between the time of day and the contributing factors of the accident?
- How does location influence the number of accidents occurring?
- Is there a trend in the number of accidents?
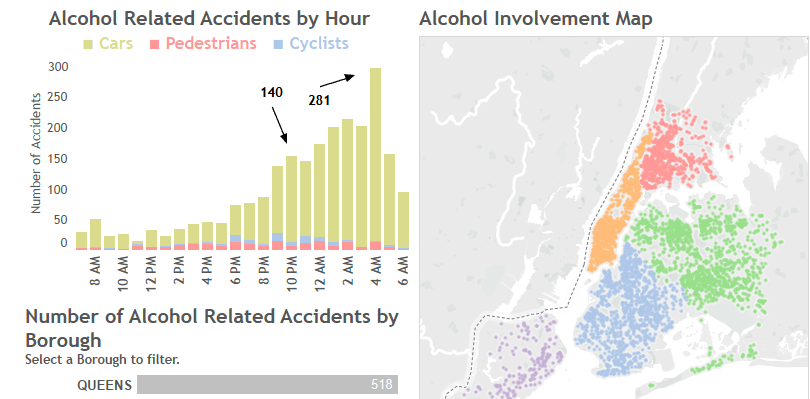
We also wanted to see if our hypothesis of “more alcohol related incidents occur between the hours of 10 p.m. and 4 a.m.” was valid. All of these questions and our hypothesis are addressed in the writeup below. First, here’s the viz for you to explore:
Our Findings
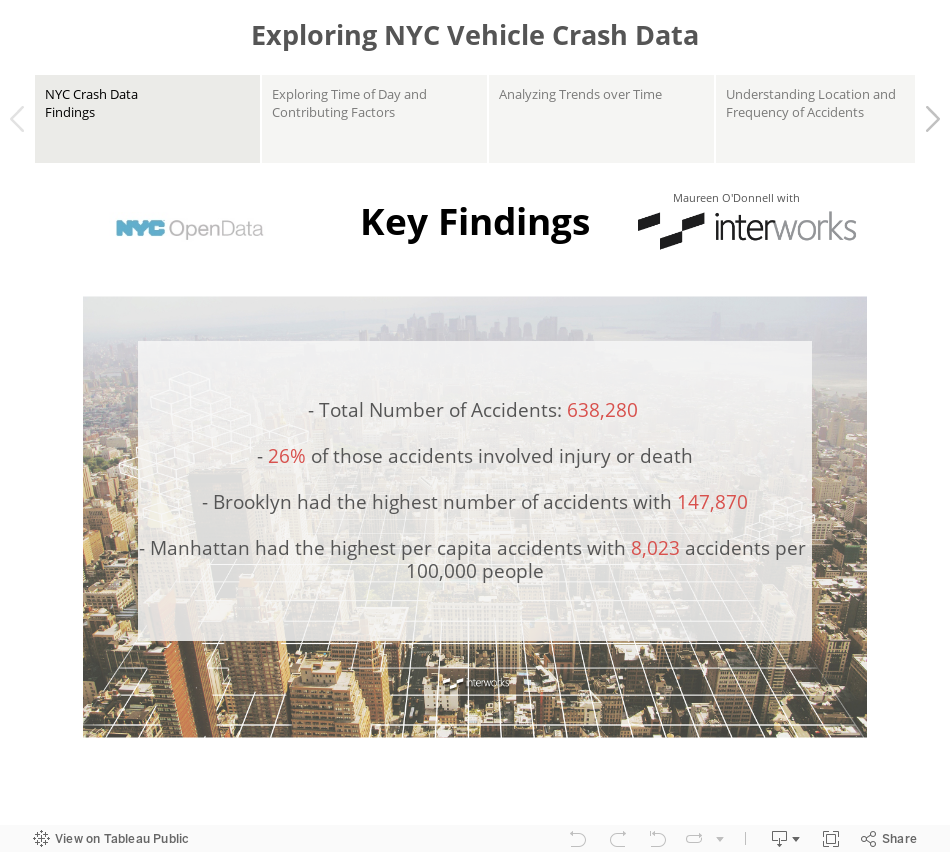
We found that while Brooklyn is the largest borough with the highest number of accidents, Manhattan had more accidents per person than any of the other boroughs. This could be due to the fact that the Manhattan population almost doubles during the workday due to the number of people commuting into the city.
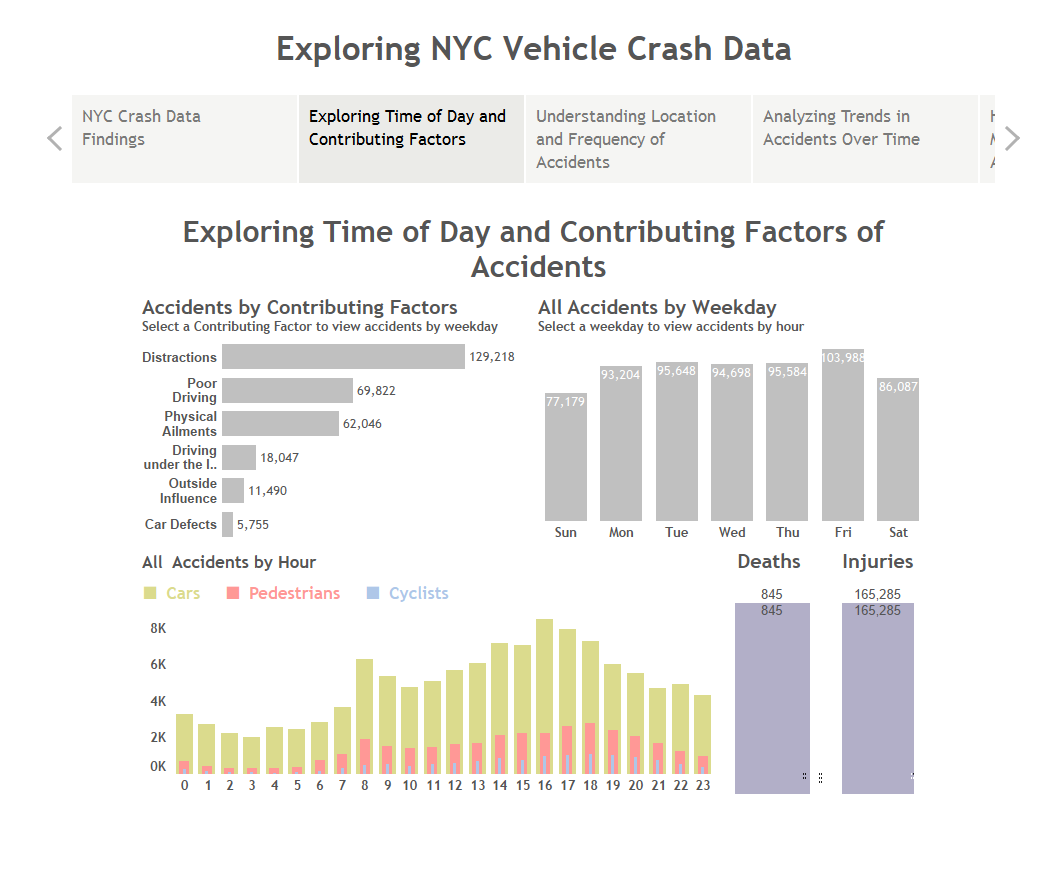
There were 48 contributing factors which we grouped into six contributing factor groups. Distractions resulted in the most accidents and the highest number of injuries. Exploring the contributing factors shows the difference in when accidents occur and which days have the highest number of accidents.
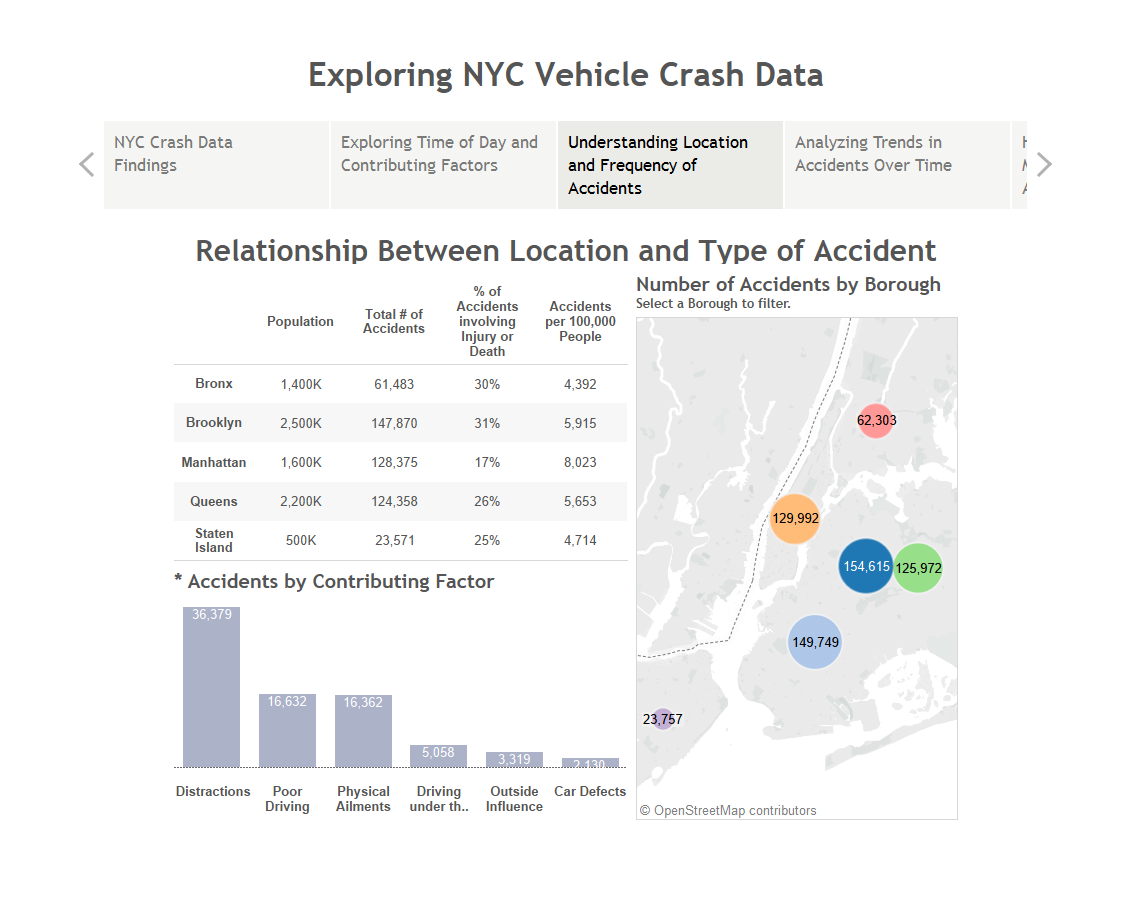
Location was a driving factor in the number of accidents occurring. Brooklyn had the largest number of accidents followed by Manhattan. The percent of accidents involving injury or death was highest in Brooklyn while Manhattan was the lowest.
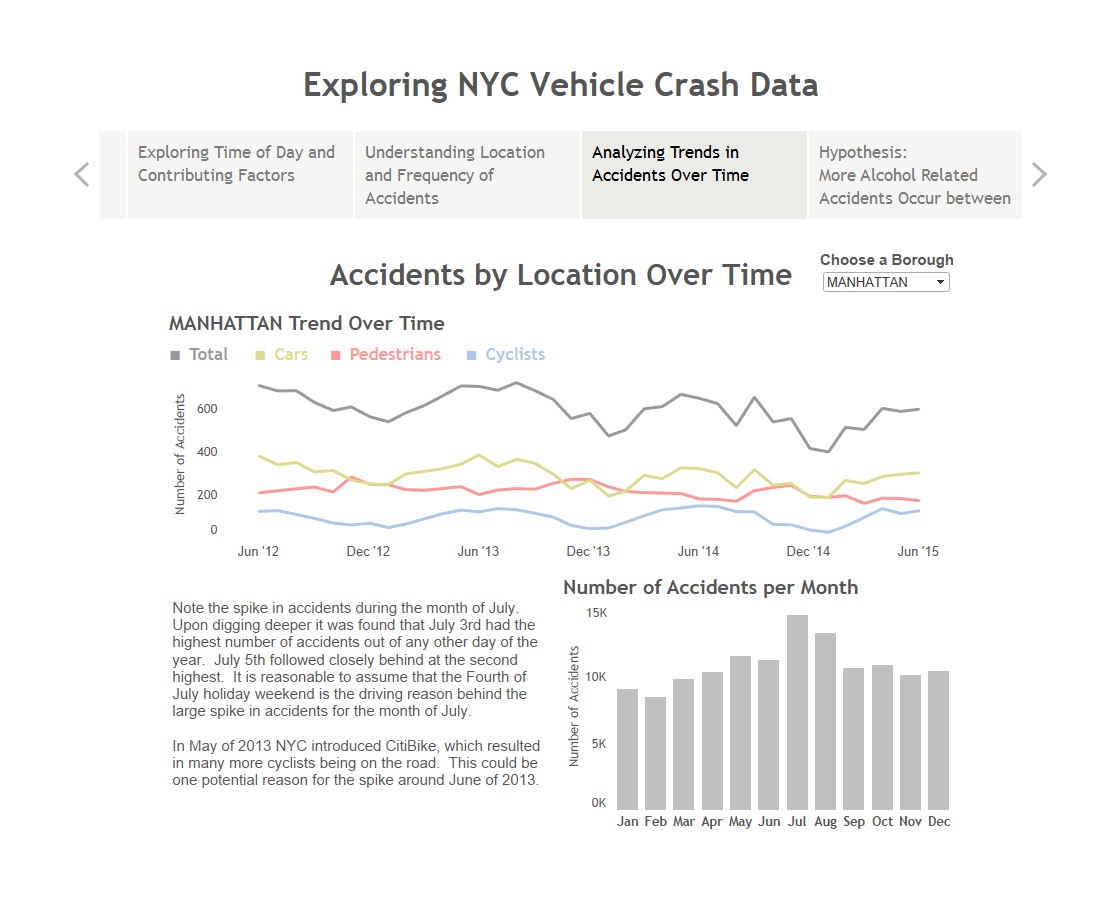
Looking at the trend of accidents over the past three years, there is no significant decrease or increase. The introduction of CitiBike in May of 2013 could be the reason for the spike in cyclists’ injuries in June of 2013.
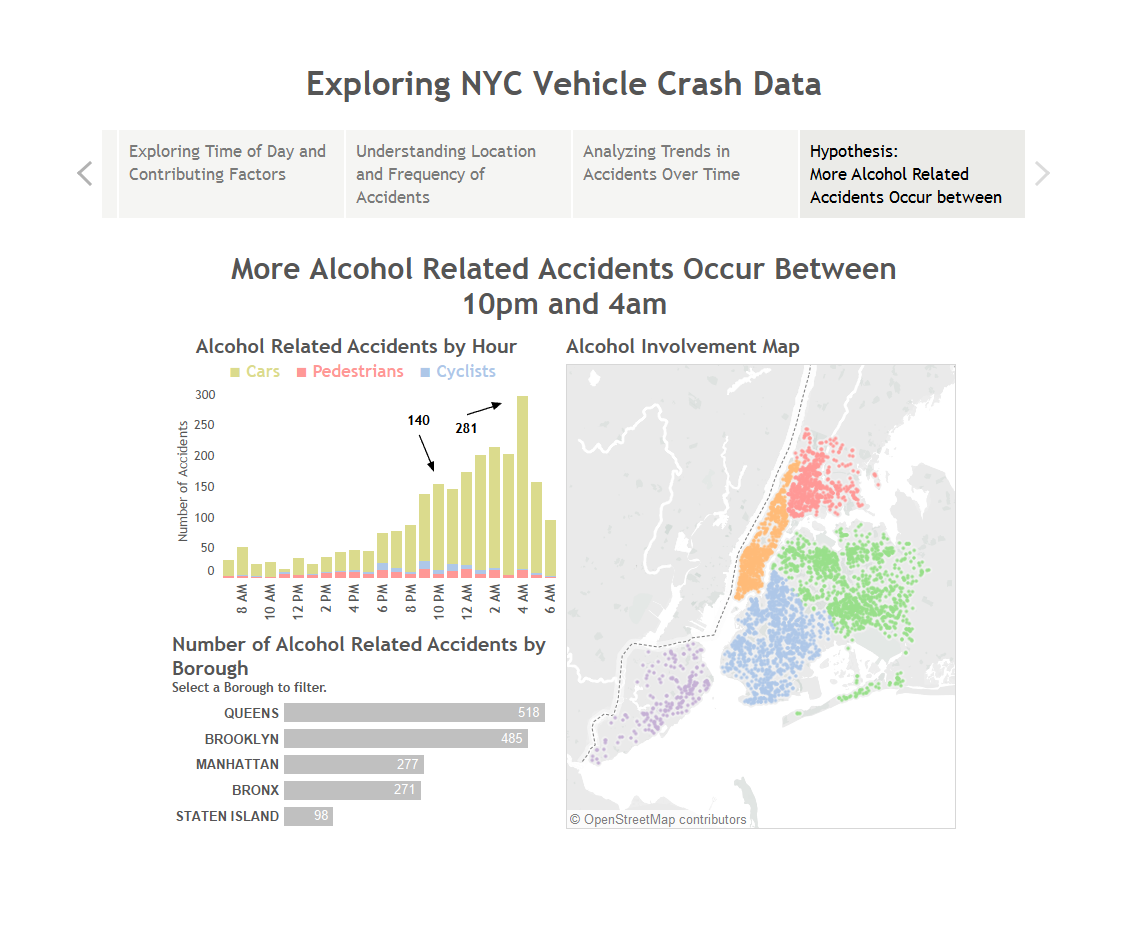
In exploring our hypothesis that more alcohol related incidents occur between the hours of 10 p.m. and 4 a.m., we found that there is a large spike in the alcohol-related accidents and injuries during the evening hours. Queens has the highest number of alcohol related incidents while Staten Island has the least.
Final Thoughts
Overall, we found that generally the larger the population of a borough, the more accidents were likely to occur. There were some interesting findings, such as the Fourth of July holiday weekend causing the spike in accidents during July as well as the alcohol-related incidents occurring during the midnight hours. We hope you’ve enjoyed our analysis of the data, and we encourage you to jump in and check out the facts on your own!
The Latest
-

PYD129 – Tableau Conference History with Dan Murray
23 April, 2024