
What you will cover:
- Aggregating extracts to different levels (Year / Month)
- Data blending
- Calculations
- Parameters
Step 1: Model your Data (read: What are you trying to analyze?)
For our specific case, we’ll have a total of 5 TDE files and our dashboard will move seamlessly through each of them using just one parameter control.
Once you’ve got the plan down, you will leverage one primary and N secondary TDE. The primary should be the most complete list of dimensions, and that’s it; you will duplicate for each level of aggregation and model accordingly (High Level Year, High Level Month, Low Level Year and Low Level Month).
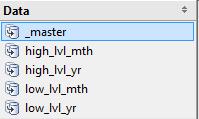
The primary (or _master) in our case looks like this (ignore the Calculated fields, we’ll get to these). Remember, this list should be exhaustive:
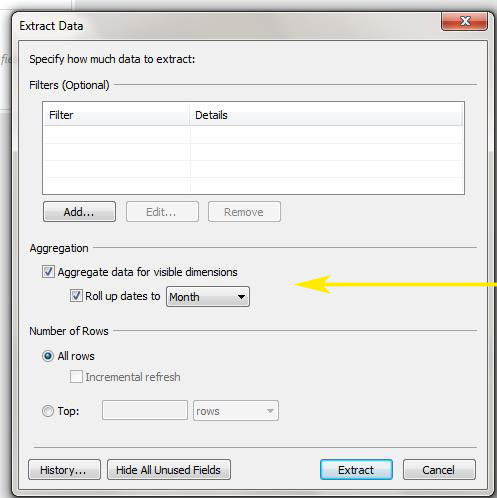
Step 2: Create the Aggregated TDE
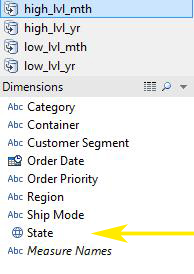
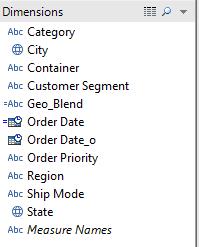
Notice that the “City” field from the “_master” was hidden in our High level (as was any unnecessary dimensions).
First, HIDE those fields you don’t need (eg: City) and then do this:
Rinse and Repeat for each level.
NOTE: For the Low-Level, make sure you include the “City” field. Duplicate the “_master” data source and hide / show the fields you want BEFORE you create the TDE.
Step 3: Create Parameter to control your extracts
![Step 3: Create Parameter to control your extracts - Edit Parameter [Extract Selection]](/wp-content/uploads/sites/default/files/blog/u143/mikeblog5.jpg)
Step 4: Create Calculated fields in the ‘_master’ data source only
First:
![Step 4: Create Calculated fields in the ‘_master’ data source only - Calculated Field [Geo_Blend]](/wp-content/uploads/sites/default/files/blog/u143/mikeblog6.jpg)
Second:
![Step 4: Create Calculated fields in the ‘_master’ data source only - Calculated Field [Order Date]](/wp-content/uploads/sites/default/files/blog/u143/mikeblog7.jpg)
NOTE: I’ve renamed the original “Order Date” because I wanted this calculated field to be recognized by the Tableau Blending feature (the name is the same and, as a result, it will blend).
Third:
![Step 4: Create Calculated fields in the ‘_master’ data source only - Calculated Field [Sales_Master_Step1]](/wp-content/uploads/sites/default/files/blog/u143/mikeblog8.jpg)
Fourth:
![Step 4: Create Calculated fields in the ‘_master’ data source only - Calculated Field [Sales_Master_Step2]](/wp-content/uploads/sites/default/files/blog/u143/mikeblog9.jpg)
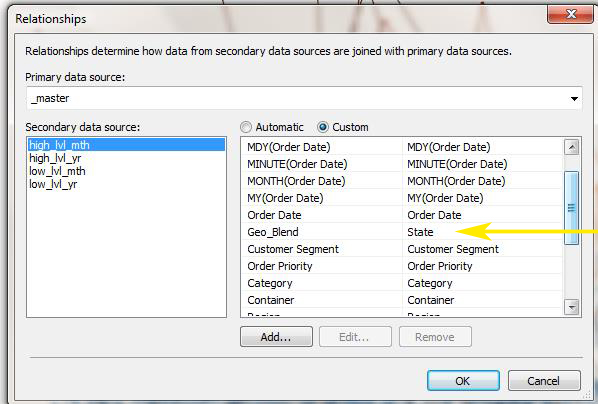
Step 5: Create and Blend
Conclusion
Since the world’s data is not getting any smaller, it makes sense to do some light “modeling” to focus the analytical process. Without focus and clarity, we’re lost and just spinning our wheels.
Also, I’ve tested this on data sets exceeding 200 million records and it’s just as fast, if not faster, than one massive TDE. Divide and rule, indeed. J
Enjoy!
-Mike