
Campers have a lot of options today! It’s not just a trip to the woods anymore but a plethora of special activities and camps to choose from. I can imagine the arduous process of finding something kids like that’s also close to your home.
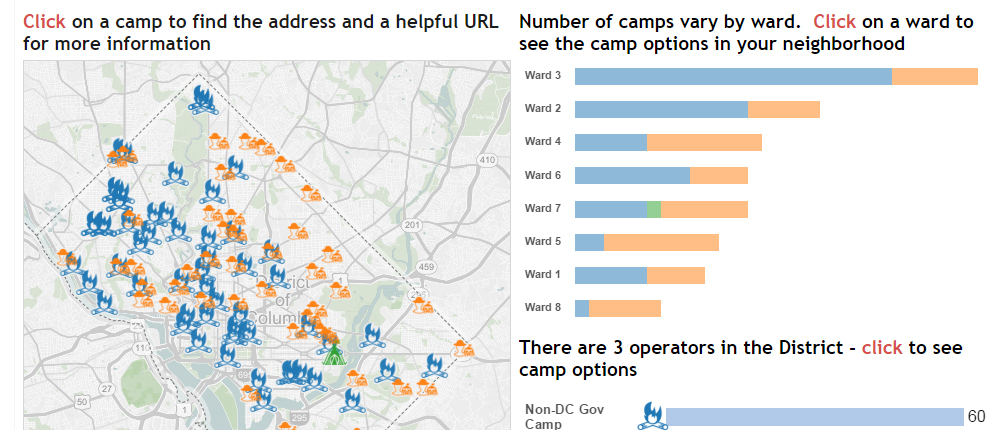
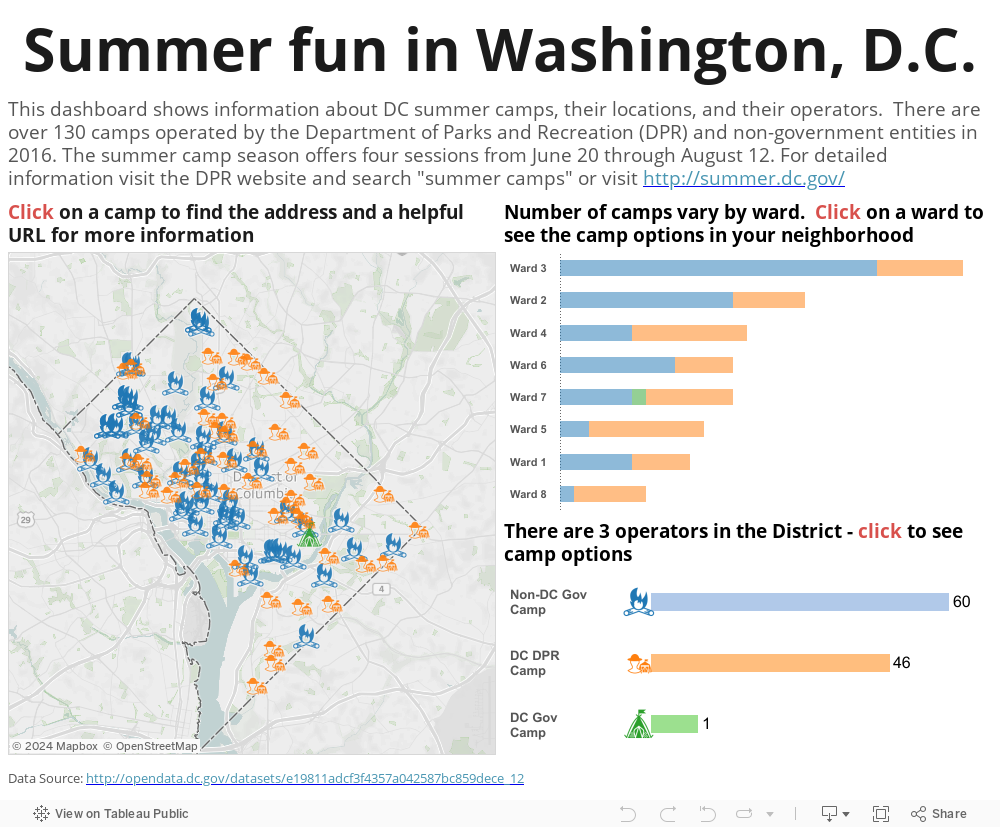
In Washington, D.C., there are over 100 camps operated by the DC Department of Parks and Recreation (DPR) and non-DC Government organizations ready to offer a true “urban camping” experience as soon as school is over.
I thought it would be interesting to visualize the opendata.dc.gov data set on summer camps 2016 and found it on the District of Columbia GIS (DC GIS) site. The site promotes discovery and use of public data set in hopes of fostering greater participation and collaboration among residents in DC and surrounding areas.
Downloading and Prepping the Data
I downloaded the data set in excel and noticed the camps were organized into Wards; had the operator information; and the locations by address, city and state. Tableau does not support address geocoding, and I wanted my shapes on the map to have the exact locations in the city.
Geocoding is the process of finding associated geographic coordinates, such as latitude and longitude, from other geographic data, such as a street address. I asked a colleague for help, and he used the Alteryx Street Geocoder tool to provide latitudes and longitudes for each camp on my excel spreadsheet.
Exploring the Data in Tableau
I was now ready to explore the data set in Tableau – this is the abstract step of creating what you like. I opted for a simple layout with three quadrants. These quadrants interact with each other and give you the option to click on a URL once you select a specific camp on the map. The URL takes you to a website for more information on that specific camp. The data set did not provide a URL for every camp, so I created a calculated field in Tableau to build my own URL logic, leveraging Google search with added parameters.
In three simple steps, downloading the open data set, geocoding the information and visualizing in Tableau, you can create a dashboard that brings all the relevant information about summer camps 2016 in one landing page. Feel free to explore the interactive Tableau data viz I created below:
The Latest
-

Kickstarting Data Innovation in Healthcare
18 April, 2024