
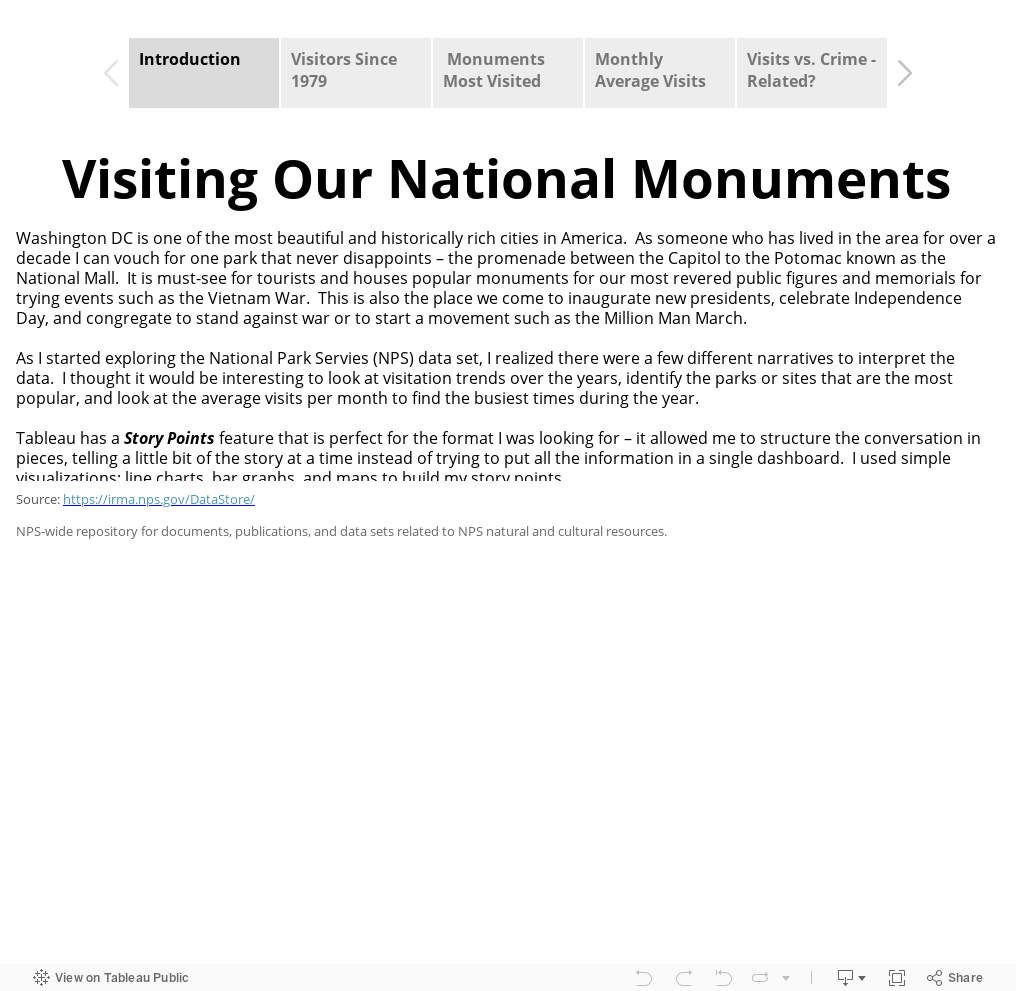
Washington, D.C. is one of the most beautiful and historically rich cities in America. As someone who has lived in the area for over a decade, I can vouch for one park that never disappoints – the promenade between the Capitol and the Potomac known as the National Mall. It is a must-see for tourists and houses popular monuments for our most revered public figures and memorials for trying events such as the Vietnam War. This is also the place we come to inaugurate new presidents, celebrate Independence Day and congregate to stand against war or to start a movement such as the Million Man March.
I was interested in finding visitation data for the National Mall and was very pleased to discover that the National Park Service (NPS) has been tracking this information through a special initiative called the Visitor Use Statistics (VUS) Program. NPS offers a useful open data site that has information on many parks around the country, and I was able to get my hands on the data I needed to begin my discovery on the National Mall. I downloaded the data in Excel, and after a little prep, I visualized the data in Tableau.
About the Data Viz
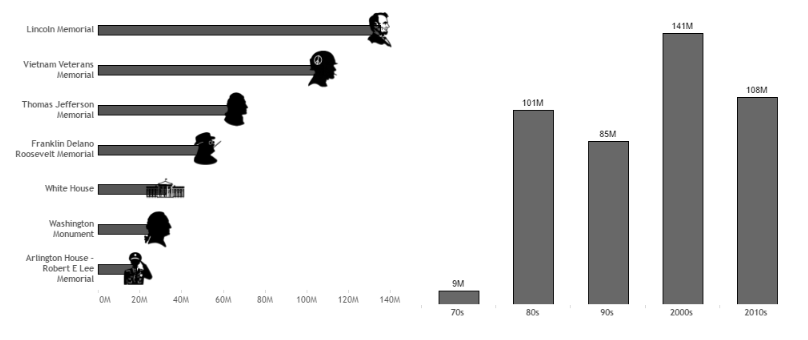
As I started exploring, I realized there were a few different narratives to interpret the data. I thought it would be interesting to look at visitation trends over the years, identify the parks or sites that are the most popular and also look at the average visits per month to find the busiest times during the year.
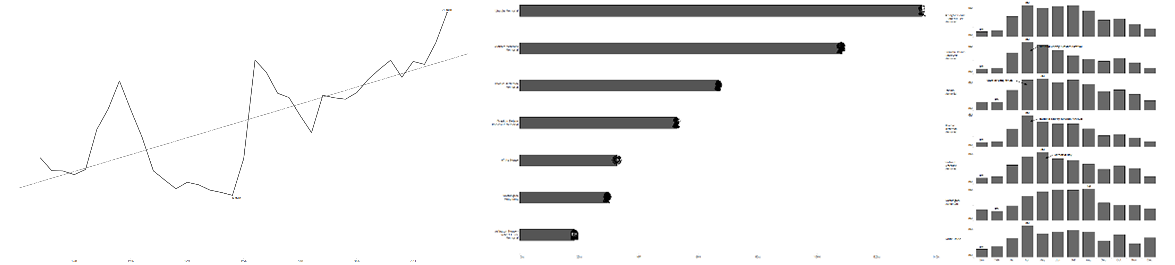
Tableau has a Story Points feature that is perfect for the format I was looking for – it allowed me to structure the conversation in pieces, telling a little bit of the story at a time instead of trying to put all the information in a single dashboard. I used simple visualizations, line charts, bar graphs and maps to build my story points.
What We Found
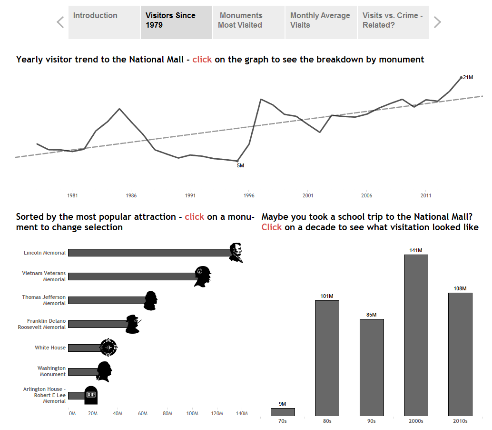
When you look at the first story point, “Visitors Since 1979,” the overall number of visitors at the National Mall has a gone up over the years. But there are clear patterns during contiguous periods on the line chart which made me wonder if there is a contributing factor for the ups and downs.
I shared my dashboard with a colleague, and we started brainstorming on what this may be. We concluded it’s not weather and it’s not park renovation; instead, we found an interesting correlation between the NPS data set and another one with Crime Statistics for Washington, D.C. We used the Tableau’s data blending feature to join the two data sources with a common field. In our case, we aggregated the data by year.
We’ll let you be the judge: Do you think there is evidence of a correlation between the number of visitors and the number of crime – maybe more so in the 80’s and 90’s? Explore the viz below to decide and peruse through other interesting visitation statistics while you’re at it.
The Latest
-

PYD129 – Tableau Conference History with Dan Murray
23 April, 2024