Tableau Deep Dive: Parameters – Calculated Fields

Data

Tableau Deep Dive: Parameters – Calculated Fields

Tableau Deep Dives are a loose collection of mini-series designed to give you an in-depth look into various features of Tableau Software.

When you combine parameters with calculated fields, you’re unlocking the potential of some powerful stuff. Obviously, no matter how deep our deep dive could go, there’s no way I could show you everything that is possible. So, we’ll use a couple of examples to get your imagination primed.

The Calculated Field Editor

As a quick refresher, the calculated field editor conveniently color-codes everything within the editor. Parameters are purple. Here’s a guide:

Tableau Calculated Field Editor Colors

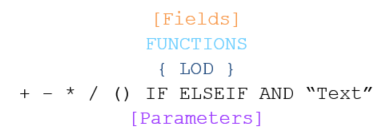
Since parameters are included in the data pane, just like with any other field, you can click and drag it into the calculated field editor.

Use Case: Parameters & Calculated Fields

For our first example, we’ll use the season data for the ten Most Valuable Player candidates from the 2015-16 NBA season. You can download the data source at the bottom of this post as a .tdsx file. In our initial view, I’ve got each of the ten MVP candidates with the number of games they have played, their average minutes and their average points per game as a horizontal bar.

Tableau Horizontal Bar Chart

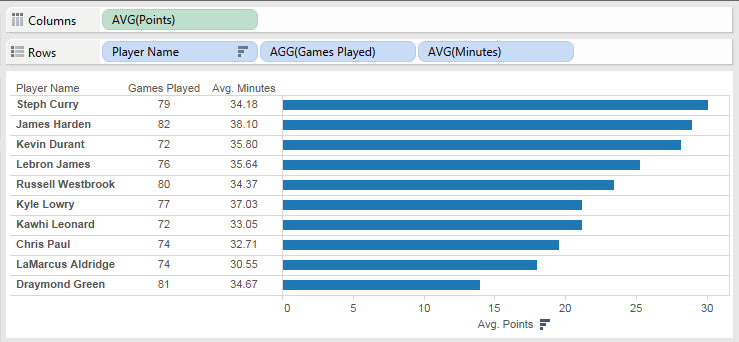
I want to give my report user the option of comparing these players in different ways. A very common way of comparing players is to normalize the amount of minutes played. For instance, Kyle Lowry plays on average 37+ minutes per game while Chris Paul plays just 32 minutes per game. The most common metric for this type of comparison is a per 36 minute performance. In doing so, we’ll adjust the points per game average as if all players each played 36 minutes.

I’ll also include season totals as my third option for the table. There are some players that played significantly less games than others and showing the total points will highlight the difference in season-wide contribution.

Let’s create a parameter to encompass these three scenarios. Just to review, here are the four steps for building and using a parameter:

  1. Create Parameter
  2. Show Parameter Control
  3. Use Parameter in Calculation
  4. Use Calculation in your View

Let’s get started.

Tableau > Create Parameter” height=”509″ src=”/wp-content/uploads/sites/default/files/blog-content/TDDParametersCF3.png” width=”572″ /></p>
<p>We’ll use these options inside of a calculated field to adjust the data that the report user is going to see. Let’s create my calculated field on each of my three scenarios:</p>
<p align=Tableau calculated field

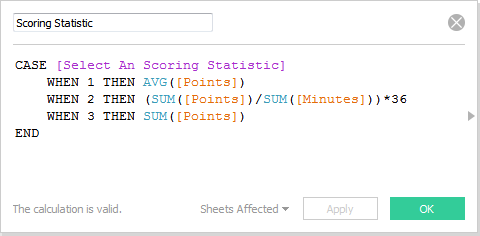
I can replace the SUM of Points measure on columns with my calculated field, Scoring Statistic. I want my view to automatically sort from highest to lowest based on which ever statistic is selected, so I’ll do a descending computed sort on the Player Name measure using Scoring Statistic.

I can now show my parameter control to get the following view:

Show parameter control

Success!

What’s Next?

Now that we have an example of calculated fields using parameters, we can return to filtering. In our next article for the Deep Dive on parameters, we’ll filter across disparate data sources on a single dashboard.

If you have any questions, thoughts, or your own use cases with parameters and calculated fields, please leave them in the comments below. I look forward to hearing from you!

Want More Tableau Deep Dives

  1. Tableau Deep Dive: LOD – Introduction to Detail
  2. Tableau Deep Dive: LOD – The Include Calculation
  3. Tableau Deep Dive: LOD – The Exclude Calculation
  4. Tableau Deep Dive: LOD – The Fixed Calculation
  5. Tableau Deep Dive: LOD – LOD Calculations vs. Table Calculations
  6. Tableau Deep Dive: Parameters – Parameter Overview
  7. Tableau Deep Dive: Parameters – Parameter Properties
  8. Tableau Deep Dive: Parameters – Filtering – Top N
  9. Tableau Deep Dive: Parameters – Calculated Fields
  10. Tableau Deep Dive: Parameters – Filtering Across Data Sources
  11. Tableau Deep Dive: Parameters – Bins
  12. Tableau Deep Dive: Parameters – Reference Lines
  13. Tableau Deep Dive: Parameters – Table Calculations
  14. Tableau Deep Dive: Sets – Introduction to Sets
  15. Tableau Deep Dive: Sets – Constant Sets
  16. Tableau Deep Dive: Sets – Computed Sets
  17. Tableau Deep Dive: Sets – IN/OUT
  18. Tableau Deep Dive: Sets – Combined Sets
  19. Tableau Deep Dive: Sets – Calculated Fields
  20. Tableau Deep Dive: Sets – Hierarchies
  21. Tableau Deep Dive: Dates – Introduction to Dates
  22. Tableau Deep Dive: Dates – Preparing Dates
  23. Tableau Deep Dive: Dates – More Date Functions
  24. Tableau Deep Dive: Dates – Exact Dates
  25. Tableau Deep Dive: Dates – Custom Dates
  26. Tableau Deep Dive: Dates – Rolling Dates
  27. Tableau Deep Dive: Dates – Calendar Filters
  28. Tableau Deep Dive: Dates – Week-by-Week Comparison
  29. Tableau Deep Dive: Dashboard Design – Planning
  30. Tableau Deep Dive: Dashboard Design – Layout & Structure
  31. Tableau Deep Dive: Dashboard Design – Proof of Concept
  32. Tableau Deep Dive: Dashboard Design – Adding Interactivity
  33. Tableau Deep Dive: Dashboard Design – Visual Best Practices
  34. Tableau Deep Dive: Dashboard Design – Optimization & Governance
  35. Tableau Deep Dive: Dashboard Design – Publishing
  36. Tableau Deep Dive: Table Calculations – Custom Sorts, Part One
  37. Tableau Deep Dive: Table Calculations – Custom Sorts, Part Two
  38. Tableau Deep Dive: Table Calculations – Custom Sorts, Part Three

More About the Author

Robert Curtis

Managing Director, APAC
Building Solutions with InterWorks at Corinium’s Data Architecture Conference in Melbourne InterWorks was a proud sponsor of the Data Architecture Conference hosted by Corinium in Melbourne on 21 and 22 June 2023. Hundreds of ...
Virtual Event Recap: Deep Dive of Tableau Parameters For our June Lunch and Learn, we did a deep dive on parameters for our friends across Australia and Singapore. Tableau is the premier ...

See more from this author →

InterWorks uses cookies to allow us to better understand how the site is used. By continuing to use this site, you consent to this policy. Review Policy OK

×

Interworks GmbH
Ratinger Straße 9
40213 Düsseldorf
Germany
Geschäftsführer: Mel Stephenson

Kontaktaufnahme: markus@interworks.eu
Telefon: +49 (0)211 5408 5301

Amtsgericht Düsseldorf HRB 79752
UstldNr: DE 313 353 072

×

Love our blog? You should see our emails. Sign up for our newsletter!