
Tableau Deep Dives are a loose collection of mini-series designed to give you an in-depth look into various features of Tableau Software.
In the last two articles of this parameters Deep Dive, we’ve learned how to use parameters with filters and within calculated fields. Now, let’s combine these skills and use a parameter to filter across disparate data sources.
Quick Review
Remember, filters are different than parameters. Filters are specific to a data source, parameters are not. Filters are created on the worksheet level. Parameters can be reused across the entire workbook. Both of these distinctions are the reason we must use a parameter instead of a filter when we are trying to filter across different data sources.
Disparate Data Sources
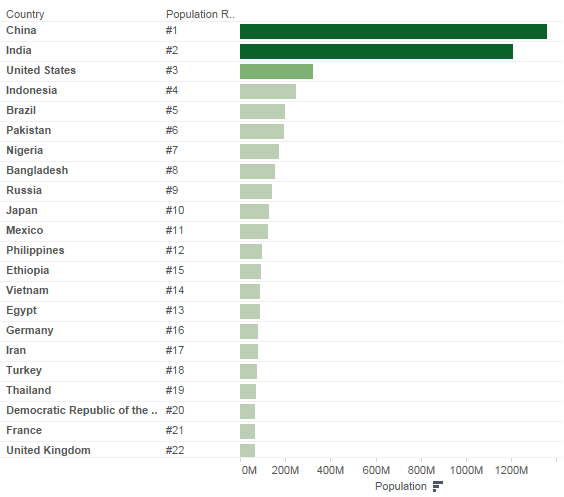
My first data source has the population of each country with a rank from most populous to least. Here’s the view:
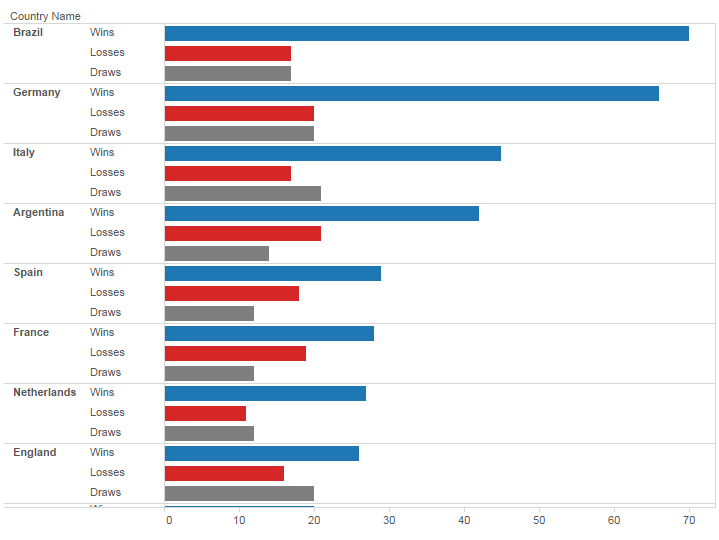
The other is the wins, losses and draws of a country at the FIFA World Cup:
I want to include both of these views on a single dashboard with a country filter control. These two views use different data sources (Population.xlsx and WorldCup.xlsx, respectively). Without using a parameter, the best I could hope for is to use two filter controls on the same dashboard and expect the user to filter each view individually.
From a usability standpoint, this is definitely subpar. When I filter one view, I want the other to be automatically affected.
Enter the Parameter
Let’s add a parameter to my workbook to get this result. My population by country data source has a larger membership of its Country field than the FIFA World Cup data source. Not every country has participated in the World Cup. So I’ll use my population data source to get a complete list of countries.
Remember our steps to using a parameter:
- Create Parameter
- Show Parameter Control
- Use Parameter in Calculation
- Use Calculation in your View
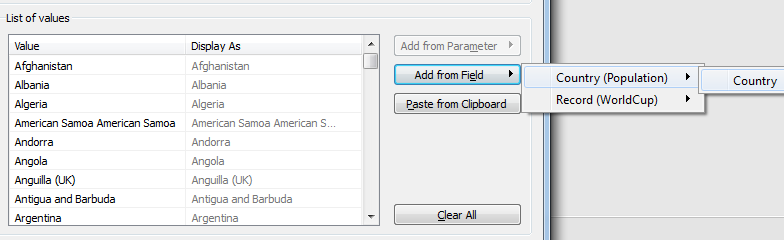
Let’s create our parameter:
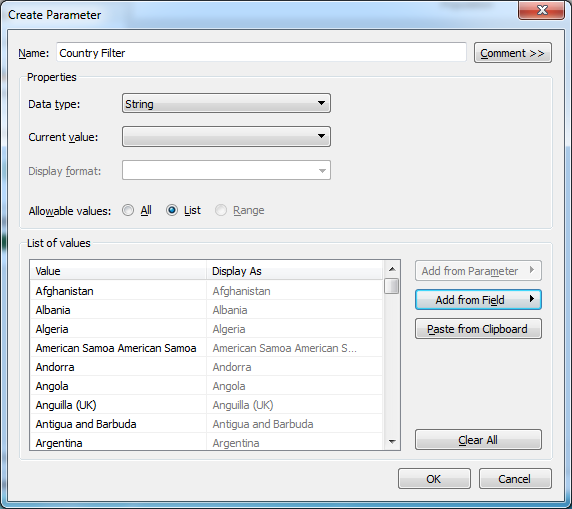
I added the country names by clicking on the Add from Field and selecting the Country dimension from the Olympics.xlsx data source:
Our parameter is now ready to be used, but first …
Pro Tip: Add the (All) Option
Let’s add another level of functionality to our parameter, the (All) option. If our report viewer wanted to see all of the countries, there’s no option for that in our parameter like there would be within a filter. So, let’s create that option in our list. Go to the bottom of the list and click on the last line of the list with the grey Add:
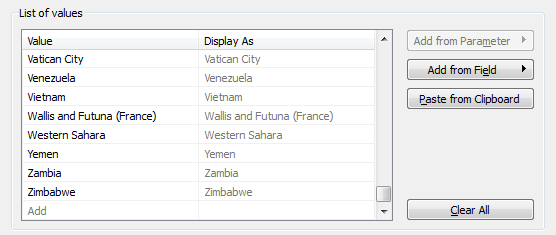
Enter in (All). We’ll use that designation because that is the same term used by Tableau within a filter. Usability is as much about making it easy for your users to user your tool as it is being consistent. Because we are adding this extra line after we populated the other values in our list, it will appear at the bottom. Again, our user probably won’t think to look for it there since Tableau puts the (All) option at the top. Click and drag it to the top of the list:
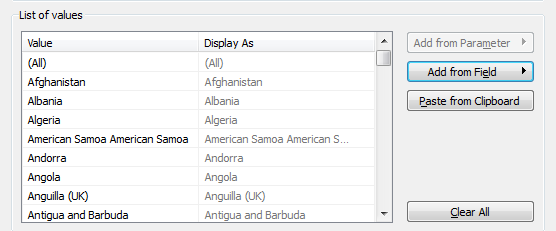
The (All) option is now in our parameter, but it won’t work just yet until we fix it up in our calculated field. Let’s select our current value as (All) so that when the list first appears, it will show all records in our view.
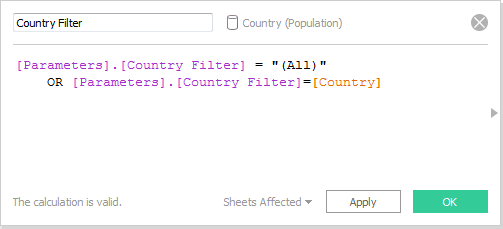
Calculated Fields
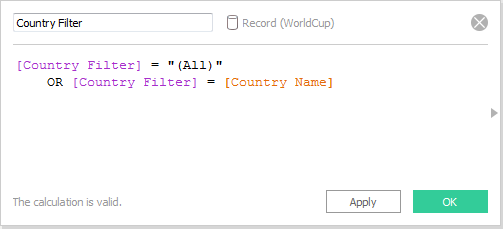
Remember the first article in this series? There are four steps in using a parameter. We’ve built our parameter. Now it’s time to use our parameter in a calculated field. We’ll need to create two different calculated fields, one for each data sources. Our country dimension in Olympics.xlsx is Country Name, so here’s our calculation:
Drag the calculated field into the view as a filter and select to filter on TRUE:
![Filter [Country Filter] > TRUE](/wp-content/uploads/sites/default/files/blog-content/TDDParametersDash9.png)
Now, let’s do the exact same thing for the World Cup view. Since neither of these data sources have been blended, these calculated fields will only appear in their separate data source. Our country dimension in the second data source is Country Name, so our calculated field would change like so:
Add this second calculated field as a filter to the World Cup view. Finally, click on Show Filter Control for each view and test clicking around on different countries to make sure that it is working. Remember, there are fewer countries that have participated in the FIFA World Cup than the Olympics, so there will be some options in your parameter that produce a blank screen for the World Cup view.
Building Your Tableau Dashboard
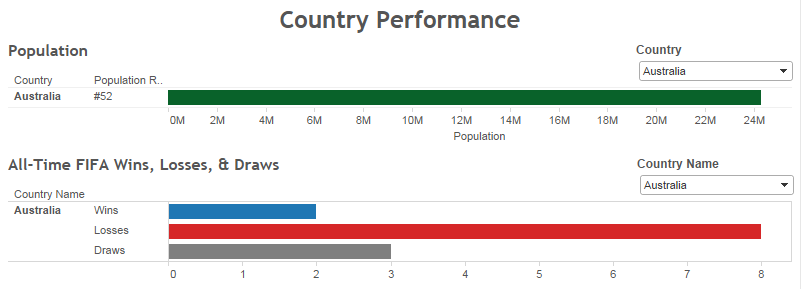
Click and drag each of the views to your dashboard. I choose to put the Country Population first and the FIFA World Cup second. I’ll use a container so that the tables will resize based on the results returned from the parameter. Given that there are some results that will produce a blank table for the World Cup, I think it makes since to put it on the bottom. With our parameter control visible on our views, it will also be visible when we drag those views to our dashboard. I’ve made the parameter control float and positioned it to the right of the dashboard title.
Now when we filter using our parameter control, both views will update:
What’s Next?
In part 6 of this Deep Dive on parameters, we’ll examine another of the standard use cases: bins. Time for some histograms! If you have any questions, thoughts or other fun use cases with parameters and filters, please leave them in the comments below. I look forward to hearing from you.