
Tableau Deep Dives are a loose collection of mini-series designed to give you an in-depth look into various features of Tableau Software.
In the next article of our Deep Dive on Parameters, we will examine reference lines. Remember, there are a lot of ways to add reference lines to your view: the Analysis drop-down menu, the Analytics pane or right-clicking on the measures axis. Also, reference line is a broad term. Don’t be confused by the breakout of different options in the Analytics menu besides the Reference Line option, such as Reference Bands, Distribution Bands, etc. You can use parameters in nearly all of them.
Use Case #1: Reference Line
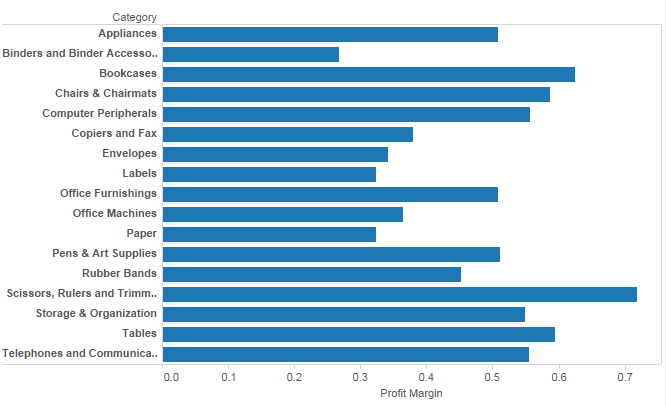
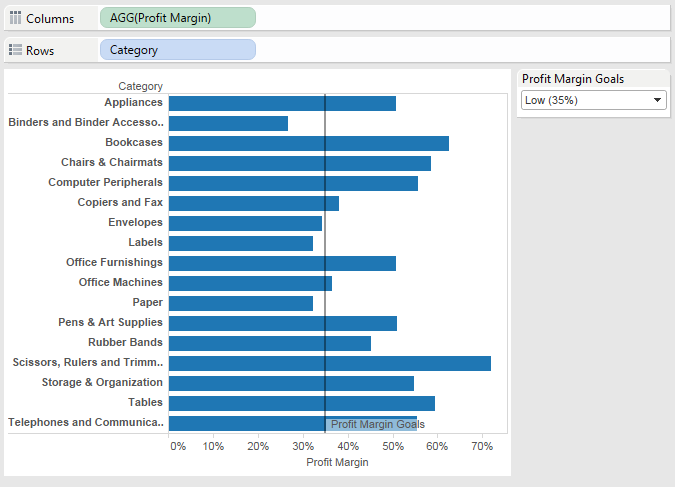
Our first use case starts with a vertical bar chart for profit margin. Remember, profit margin is:
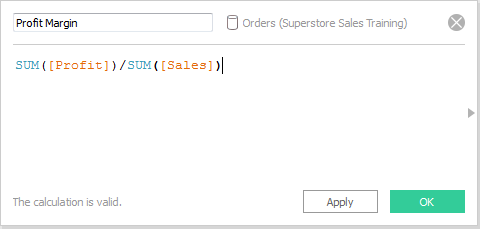
Here’s our initial view:
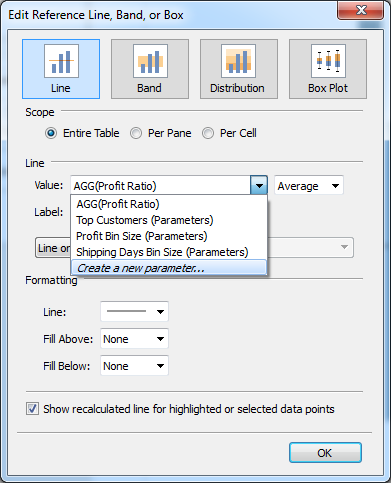
I’ve got different profit margin goals that I want to compare to my actual performance. I want to take those goals and use them to create a parameterized reference line. We’ll start by adding a reference line. However, if you end up adding it from the various ways available, you’ll end up with the Edit Reference Line, Band or Box window.
Go to your Line Value drop-down and select Create New Parameter:
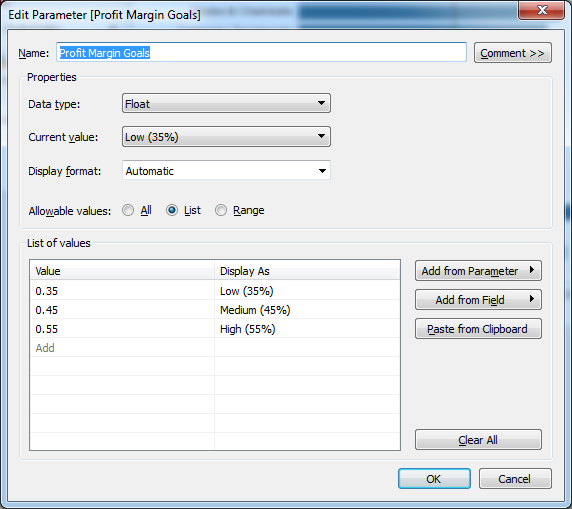
Here’s my parameter:
This is how my view appears now:
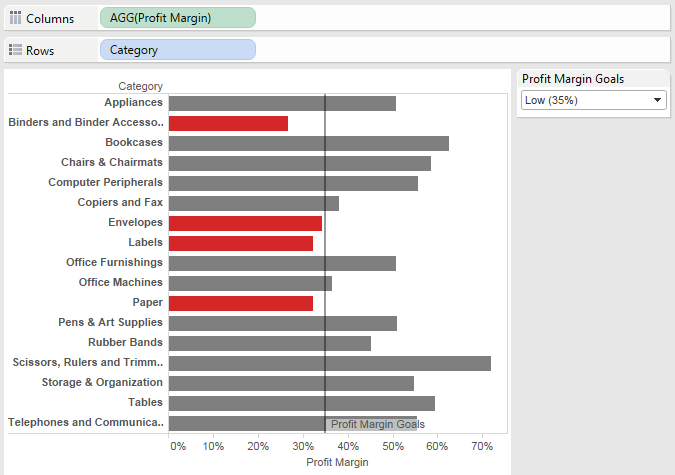
Just to make it a little more useful, I’m going to add some conditional formatting to color my marks that fall below the reference line in red. When the report user changes the parameter, the color of my marks will also change. To do this, we’ll create a simple calculation to create a True or False for our formatting:
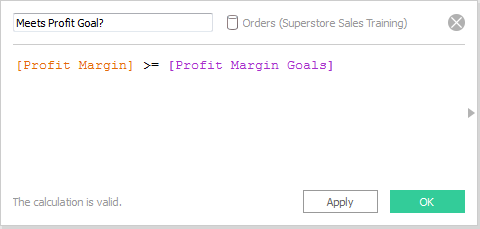
Profit Margin is our measure and Profit Margin Goals is our parameter. I’ll drag our newly created calculated field onto the Color shelf on the Marks card and adjust the colors appropriately to get the following:
A quick aside on the color scheme for the above view: By making my True grey and my False red, this view is really a warning on poor performers. I’m drawing attention to the fact that Binders and Paper are not performing up to our profit margin goal. Perhaps our profit margin goal is a minimum threshold? By switching the color scheme to True blue and False grey, it takes a tone of highlighting successes:
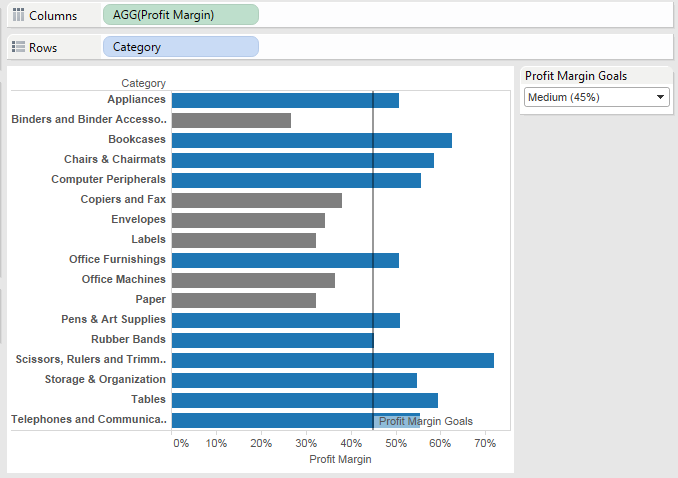
See the difference? This is not specifically related to parameters, but it’s a good opportunity to illustrate how even the color of your marks can lead the report user into the story you’re trying to tell whether it’s trumpeting business successes (blue) or raising concern about failures (red).
Bullet Graph
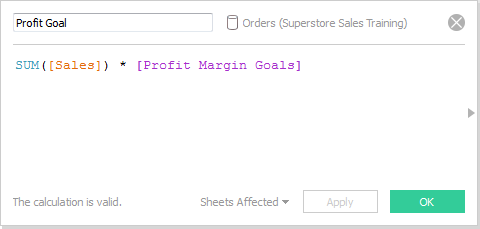
We’ll take what we just learned and add it to a bullet graph, which is the Tableau community’s answer to gauges. I’m going to create a profit goal based on a percentage of sales. That percentage is going based on Profit Margin Goals parameter. Here is my new calculated field for my Profit Goals:
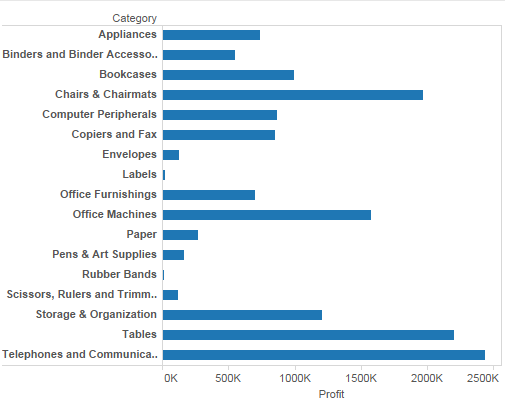
I’m ready now to create my view. I’ll start by adding Profit to Columns with Category on Rows:
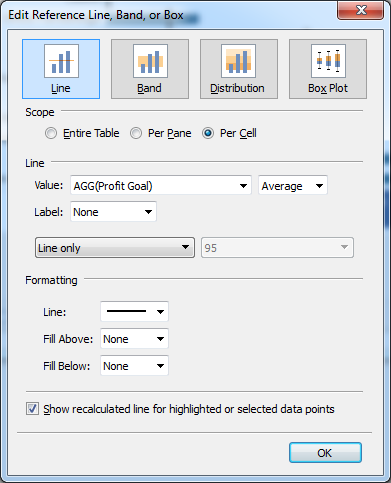
Now it’s time to use our Analytics pane to add reference lines and distribution bands. Add our calculated field, Profit Goal, to the Detail button. Let’s start with our reference line as so:
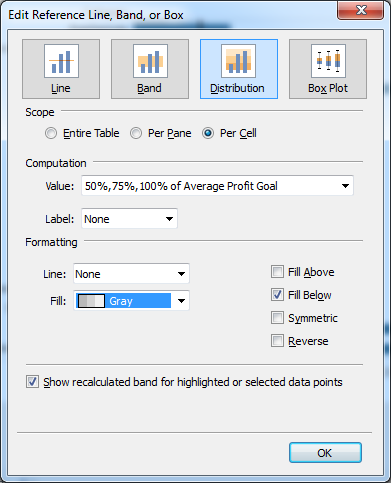
And now our distribution bands:
Our view now looks like this:
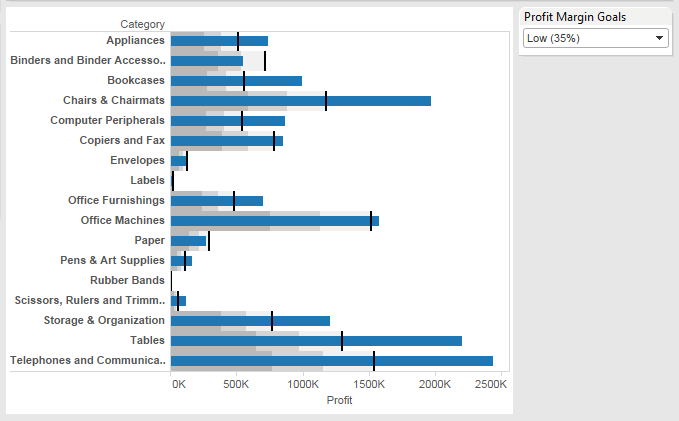
The distribution bands are showing shaded areas of grey around each bar to show progress. In this case the grey areas represent milestones of 50%, 75% and 100% progress towards our profit goal. The reference line provides the finish line with a thick black line, clearly indicating which categories have surpassed our profit goals.
Eureka!
What’s Next?
What other ideas do you have in parameterizing your reference lines? What could you do with a bullet graph?
In the next article, we’ll examine how parameters can be used in table calculations. If you have any comments or questions, leave them in the area provided below. Thanks!