Questions from Tableau Training: Can I Manually Set the Colors of a Stepped Gradient?

Data

Questions from Tableau Training: Can I Manually Set the Colors of a Stepped Gradient?

Our Certified Tableau Trainers are asked a myriad of questions each day. In this series, they share some answers.

From my Melbourne Advanced class last week, I received the following question from one of my students, Arpan:

Can I manually set the colors of a stepped gradient?”

The quick answer is: Yes, you can! Let’s learn more about this question and potential use cases for the solution.

Stepped Gradient

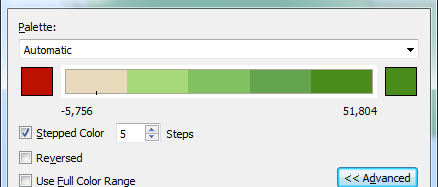
What Arpan was referring to was changing a gradient into a stepped color progression in the Color shelf. For instance:

Stepped color in Tableau

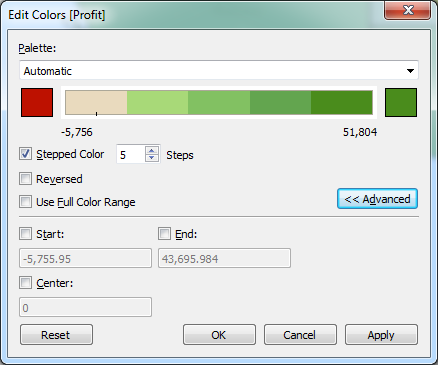
Using stepped color with such a heavy emphasis on one side of the center point means that you get grey at one point instead of a clear red with a lot of shades of green on the other side. You can edit either end of the color gradient inside of the color tool, but you cannot edit individual steps in the gradient. When used like this, you end up getting a lot of grey at the lower end of the gradient rather than anything close to bright red. To get that red, you’d only be able to use two or three steps in your gradient.

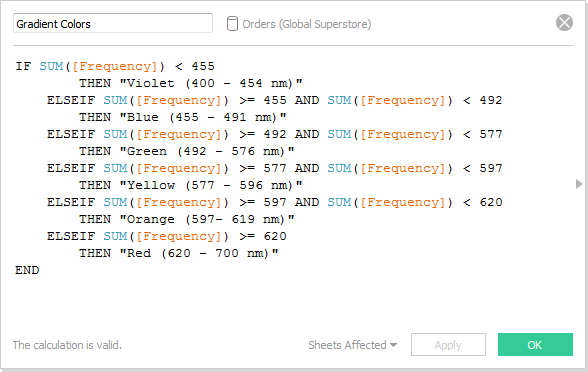
Even beyond just having a clearer lower gradient, there are other use cases for a custom color gradient. Consider data that has distribution bands that don’t necessarily fall into an easy good vs. bad balance. For instance, visible light is divided into different spectrums based on the frequency. Here are the different bands of visible light with their associated wavelength:

Violet 400 – 455 nm
Blue 455 – 492 nm
Green     492 – 577 nm
Yellow    577 – 597 nm
Orange  597 – 620 nm
Red 620 – 700 nm

Your measure may also have bands that deserve different color distinctions. Let’s find a way to accomplish this.

Solution

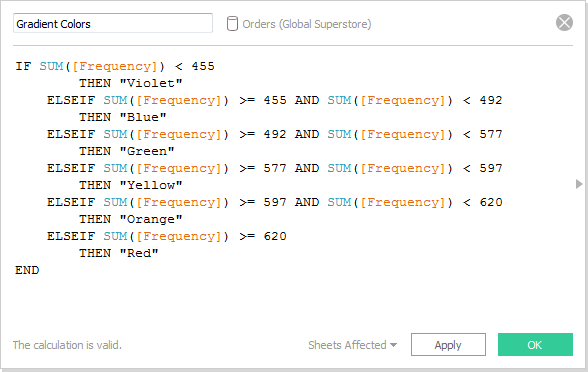
While you cannot create custom color steps within your gradients inside of the Color shelf, you can do it using a calculated field. It also gives you a greater degree of control of where you stepped color changes from one to the other by manually creating the range. Here’s the calculated field I’d use for the visible light frequencies above:

Tableau calculated field for color frequencies

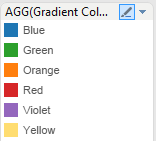
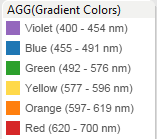
Next, drag your new calculated field onto Color and edit the color options to match your new palette:

Tableau color legend

As an extra step, you can include the range of values within each value defined in the calculated field to give the user even more information on the legend:

Adding more info to our Tableau color calc

This updates the color legend to include a range of values for each color. Our color legend is going to sort alphabetically by default, so let’s click and drag the colors to sort them in the legend to get something like this:

Tableau color legend with additional info added

Hope this helps!

Want More Questions from Tableau Training

  1. Questions from Tableau Training: Quick Filter Interaction
  2. Questions from Tableau Training: Labeling with Table Calculations
  3. Questions from Tableau Training: Speeding Up Presentation Views when Using Tableau
  4. Questions from Tableau Training: Dashboard Actions
  5. Questions from Tableau Training: Business Day Calculations
  6. Questions from Tableau Training: Adding Gaps Between Bars
  7. Questions from Tableau Training: When to Pivot Data in Tableau
  8. Questions from Tableau Training: Adding Conditional Formatting
  9. Questions from Tableau Training: Setting Weekday Start
  10. Questions from Tableau Training: How Do ZIP Codes Work in Tableau?
  11. Questions from Tableau Training: The Small Grey Bar Within a Quick Filter
  12. Questions from Tableau Training: Matching Mark Color
  13. Questions from Tableau Training: Showing the Null Indicator
  14. Questions from Tableau Training: Can I Manually Set the Colors of a Stepped Gradient?
  15. Questions from Tableau Training: How Can I Get Box Plot Data into a Crosstab?
  16. Questions from Tableau Training: How Do I Clear a Worksheet? Make a Copy?
  17. Questions from Tableau Training: Opening URL Actions Inside of a Dashboard
  18. Questions from Tableau Training: Can I Move Mark Labels?
  19. Questions from Tableau Training: How Can I Use My Current Report to Create a Viz?
  20. Questions from Tableau Training: Can I Create Text Hyperlinks on a Dashboard?
  21. Questions from Tableau Training: How Can I Transform My Crosstab into a Flat List?
  22. Questions from Tableau Training: Labeling the Top N
  23. Questions from Tableau Training: How Can I Customize Charts with Parameters?
  24. Questions from Tableau Training: Combining Measures into a Single Line
  25. Questions from Tableau Training: How Can I Create Custom Color Palettes?
  26. Questions from Tableau Training: Can a Top N Parameter be Nested Within Other Fields?
  27. Questions from Tableau Training: Conditional Scope on Tableau Calculations
  28. Questions from Tableau Training: Top Ten Plus N
  29. Questions from Tableau Training: Dynamic Label Positioning
  30. Questions from Tableau Training: Using Cross Joins to Solve Active Tickets
  31. Questions from Tableau Training: Top N Highlight Table
  32. Questions from Tableau Training: How to Use Specific Dimensions in Table Calculations
  33. Questions from Tableau Training: Moving Reference Line Labels
  34. Questions from Training: Comparing Metrics for Same Weekday in Previous Year
  35. Questions from Tableau Training: Colouring Specific Columns and Rows in a Crosstab
  36. Questions from Tableau Training: Creating a Custom Legend as a Sheet
  37. Questions from Tableau Training: How Can I Draw a 45-Degree Angle?
  38. Questions from Tableau Training: Down the Aggregation Rabbit Hole
  39. Questions from Tableau Training: Percent Change from Previous Period on a Map
  40. Questions from Tableau Training: Union File Names as Years
  41. Questions from Tableau Training: Conditional Coloring on Sparklines
  42. Questions from Tableau Training: Moving Column Headers to the Top of the View
  43. Questions from Tableau Training: Isolating Rank with Parameters and Calculations

More About the Author

Robert Curtis

Managing Director, APAC
Kickstarting Data Innovation in Healthcare On 13 March 2024, InterWorks was a proud Platinum sponsor of the first ever Data & Analytics in Healthcare conference, hosted by ...
Building Solutions with InterWorks at Corinium’s Data Architecture Conference in Melbourne InterWorks was a proud sponsor of the Data Architecture Conference hosted by Corinium in Melbourne on 21 and 22 June 2023. Hundreds of ...

See more from this author →

InterWorks uses cookies to allow us to better understand how the site is used. By continuing to use this site, you consent to this policy. Review Policy OK

×

Interworks GmbH
Ratinger Straße 9
40213 Düsseldorf
Germany
Geschäftsführer: Mel Stephenson

Kontaktaufnahme: markus@interworks.eu
Telefon: +49 (0)211 5408 5301

Amtsgericht Düsseldorf HRB 79752
UstldNr: DE 313 353 072

×

Love our blog? You should see our emails. Sign up for our newsletter!