Questions from Tableau Training: How Can I Get Box Plot Data into a Crosstab?

Data

Questions from Tableau Training: How Can I Get Box Plot Data into a Crosstab?

Our Certified Tableau Trainers are asked a myriad of questions each day. In this series, they share some answers.

Another great question from one of my Advanced classes as posed by Yelda:

“I love box-and-whisker plots, but how do I export that data out? I want to grab the median, the quartiles, everything and put it into a crosstab.”

Awesome question! Let’s find a solution.

bo

Box Plots

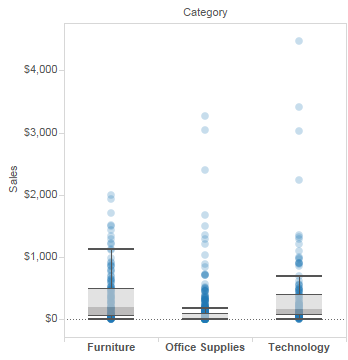
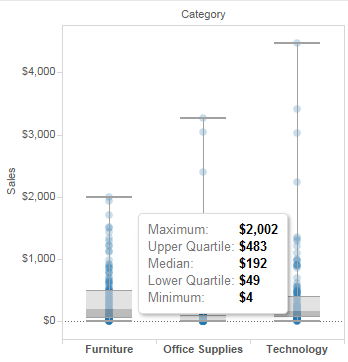
As a quick review, box and whisker plots create a box around the second and third quartiles of a range of disaggregated data points. The bottom and top “whiskers” extend to the first and fourth quartiles. Outliers are disregarded in terms of finding that middle 50, situated around the median. Here’s an example of a box plot using sales and product category:

Tableau box and whisker plot

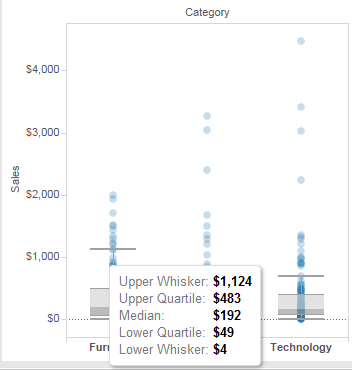
The data that Yelda was looking for is contained in the tooltip whenever I mouse over a component of the box plot:

Box plot component

The problem is that here is no way to bring this data out of the box and whisker plot. Everything you can think of to try (export my data, export to a crosstab, copy my data, duplicate as crosstab, etc.) instead gives you the disaggregated sales for each sub-category like this:

Disaggregated sales

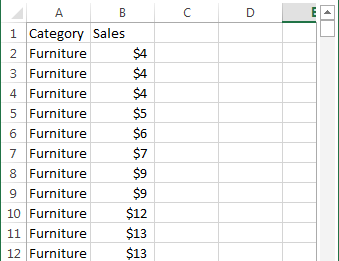
Unfortunately, there is no easy way to grab this like there would be for a trend line or forecast using the Describe option. So, we have to build it.

The Solution

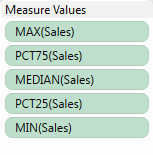
Let’s recreate the box plot and all of its great data in the tooltips instead as a crosstab. We can easily determine the lower quartile, the median, and the upper quartile by changing the aggregation type of each instance of Sales. Do the following for each:

  • Median: change the aggregation type to MEDIAN()
  • Lower Quartile: change the aggregation type to PERCENTILE and select 25
  • Upper Quartile: change the aggregation type to PERCENTILE and select 75

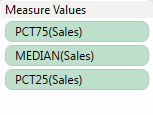
When you add these to your crosstab, your Measures Value card will look like this:

Measure Values

Next, we need to decide if how we want to format the marks outside of the middle 50. The options of a box plot have two different options on how outliers are treated.

Tableau Edit Reference Line, Band, or Box

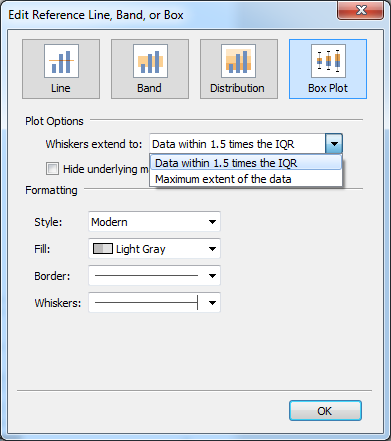
Option 1: Calculate Outliers

Anything beyond 1.5 times the interquartile range from the upper and lower quartile is considered an outlier. To calculate the interquartile range (IQR), we take the difference between the upper quartile and the lower quartile. For instance, in the Furniture category the IQR is 483 minus 49 or 434. In that example, the upper and lower whisker should extend from -602 to 1,134.

To accomplish this in our calculated field, we must use a Level of Detail calculation. For the Upper Whisker:

Upper Whisker

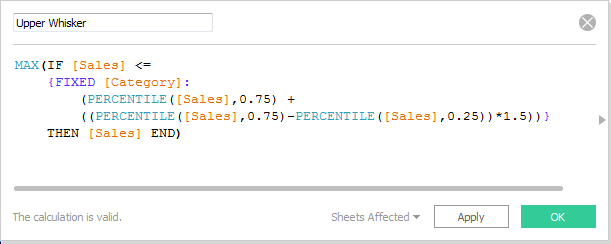
For the Lower Whisker:

Lower Whisker

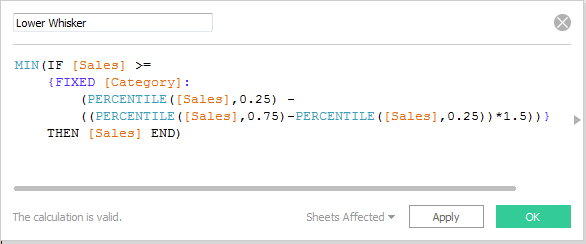
If you have any filters on your data, it’s important to add them to context, else the Level of Detail calculations will return results from a broader selection of data than what is in your viz.

Option 2: No Outliers

For the second option, “Maximum extent of the data,” our box plot does not consider outliers. Here’s how the box plot looks like with a tooltip displayed.

Box plot with tooltip displayed

The formula to determine the Minimum and the Maximum is quite simple, drag two more Sales measures onto your Measure Values card and change the aggregation for each:

  • Maximum: change the aggregation type to MAX()
  • Minimum: change the aggregation type to MIN()

Our Measure Values card now looks like this:

Measure Values

Final Viz

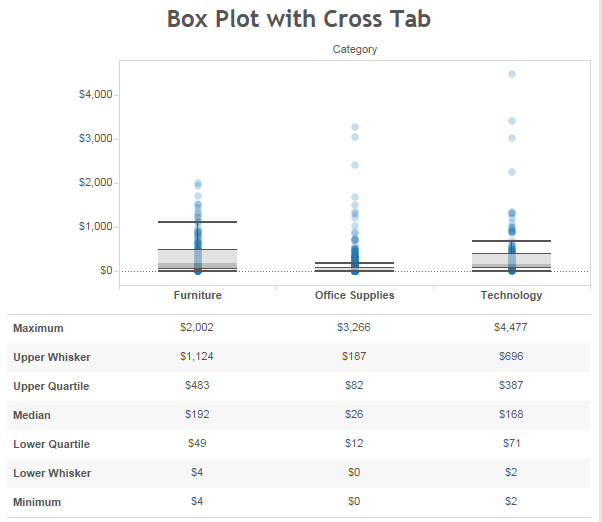
Let’s put everything we’ve just done into a single view, including our Upper and Lower Whiskers along with our Min and Max. We’re ready to export our data and keep all of our great box plot information now.

Cross tab

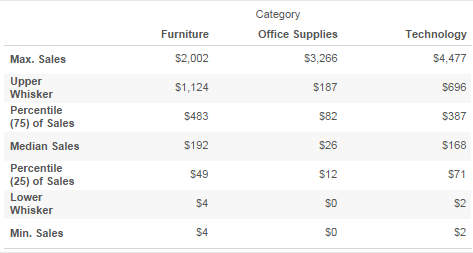
As a final step, we’ll edit our aliases and combine our box plot and our crosstab onto a dashboard for our final viz:

Box Plot with a Cross Tab

Finito! You can download the TWBX file for this example below.

Thanks to Carl Slifer for his contributions to this article.

Want More Questions from Tableau Training

  1. Questions from Tableau Training: Quick Filter Interaction
  2. Questions from Tableau Training: Labeling with Table Calculations
  3. Questions from Tableau Training: Speeding Up Presentation Views when Using Tableau
  4. Questions from Tableau Training: Dashboard Actions
  5. Questions from Tableau Training: Business Day Calculations
  6. Questions from Tableau Training: Adding Gaps Between Bars
  7. Questions from Tableau Training: When to Pivot Data in Tableau
  8. Questions from Tableau Training: Adding Conditional Formatting
  9. Questions from Tableau Training: Setting Weekday Start
  10. Questions from Tableau Training: How Do ZIP Codes Work in Tableau?
  11. Questions from Tableau Training: The Small Grey Bar Within a Quick Filter
  12. Questions from Tableau Training: Matching Mark Color
  13. Questions from Tableau Training: Showing the Null Indicator
  14. Questions from Tableau Training: Can I Manually Set the Colors of a Stepped Gradient?
  15. Questions from Tableau Training: How Can I Get Box Plot Data into a Crosstab?
  16. Questions from Tableau Training: How Do I Clear a Worksheet? Make a Copy?
  17. Questions from Tableau Training: Opening URL Actions Inside of a Dashboard
  18. Questions from Tableau Training: Can I Move Mark Labels?
  19. Questions from Tableau Training: How Can I Use My Current Report to Create a Viz?
  20. Questions from Tableau Training: Can I Create Text Hyperlinks on a Dashboard?
  21. Questions from Tableau Training: How Can I Transform My Crosstab into a Flat List?
  22. Questions from Tableau Training: Labeling the Top N
  23. Questions from Tableau Training: How Can I Customize Charts with Parameters?
  24. Questions from Tableau Training: Combining Measures into a Single Line
  25. Questions from Tableau Training: How Can I Create Custom Color Palettes?
  26. Questions from Tableau Training: Can a Top N Parameter be Nested Within Other Fields?
  27. Questions from Tableau Training: Conditional Scope on Tableau Calculations
  28. Questions from Tableau Training: Top Ten Plus N
  29. Questions from Tableau Training: Dynamic Label Positioning
  30. Questions from Tableau Training: Using Cross Joins to Solve Active Tickets
  31. Questions from Tableau Training: Top N Highlight Table
  32. Questions from Tableau Training: How to Use Specific Dimensions in Table Calculations
  33. Questions from Tableau Training: Moving Reference Line Labels
  34. Questions from Training: Comparing Metrics for Same Weekday in Previous Year
  35. Questions from Tableau Training: Colouring Specific Columns and Rows in a Crosstab
  36. Questions from Tableau Training: Creating a Custom Legend as a Sheet
  37. Questions from Tableau Training: How Can I Draw a 45-Degree Angle?
  38. Questions from Tableau Training: Down the Aggregation Rabbit Hole
  39. Questions from Tableau Training: Percent Change from Previous Period on a Map
  40. Questions from Tableau Training: Union File Names as Years
  41. Questions from Tableau Training: Conditional Coloring on Sparklines
  42. Questions from Tableau Training: Moving Column Headers to the Top of the View
  43. Questions from Tableau Training: Isolating Rank with Parameters and Calculations

More About the Author

Robert Curtis

Managing Director, APAC
Kickstarting Data Innovation in Healthcare On 13 March 2024, InterWorks was a proud Platinum sponsor of the first ever Data & Analytics in Healthcare conference, hosted by ...
Building Solutions with InterWorks at Corinium’s Data Architecture Conference in Melbourne InterWorks was a proud sponsor of the Data Architecture Conference hosted by Corinium in Melbourne on 21 and 22 June 2023. Hundreds of ...

See more from this author →

InterWorks uses cookies to allow us to better understand how the site is used. By continuing to use this site, you consent to this policy. Review Policy OK

×

Interworks GmbH
Ratinger Straße 9
40213 Düsseldorf
Germany
Geschäftsführer: Mel Stephenson

Kontaktaufnahme: markus@interworks.eu
Telefon: +49 (0)211 5408 5301

Amtsgericht Düsseldorf HRB 79752
UstldNr: DE 313 353 072

×

Love our blog? You should see our emails. Sign up for our newsletter!