
Tableau Deep Dives are a loose collection of mini-series designed to give you an in-depth look into various features of Tableau Software.
Computed sets use logic to dynamically update the membership of the set. This is the key distinction between constant sets and computed ones. Changes to the data will change the set itself as it re-computes what gets classified as IN the set and what gets classified as OUT of the set.
Computed sets can only use a single dimension whereas constant sets might have multiple dimensions in their membership (as illustrated in part two of this Deep Dive).
Creating a Computed Set
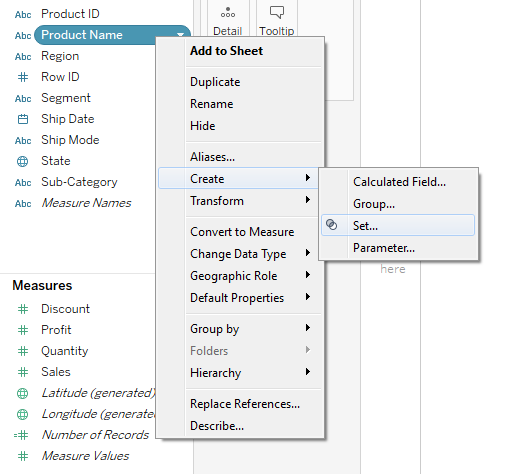
To create a computed set, right-click on any dimension in the Data pane and select Create > Set:
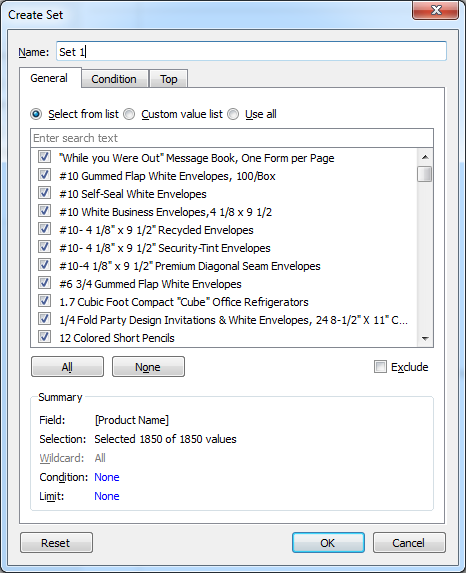
That brings up the criteria-based Create Set window just like we did in part two of this Deep Dive. We’ll examine the features available here in greater depth. This window gives you the ability to create criteria on how your set is computed.
As an example, I want to expand upon my set that I created in part two where I focused on all products by a particular manufacturer (Eldon). I will create a set from my Eldon products, focusing on the top three most profitable products that have at least $100 in sales. I want any Eldon product that is added later to be dynamically included in my set unlike the set I created in part two of this series.
To accomplish this set, I’m going to use features on the Condition and Top tabs.
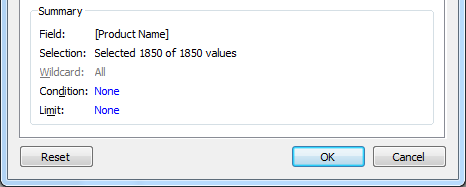
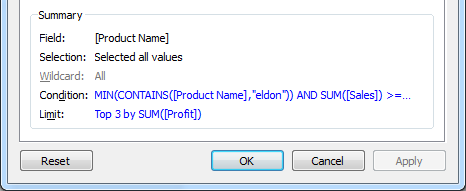
First, I want to call your attention back to the Summary area. It is located at the bottom of the General tab and shows all of the different criteria I’ve constructed in building my set as well as the number of current members. Another important thing to note is that it is only here in the Summary area where you get the reminder of which dimension you’re using to create your set.
In the use case example, my dimension is Product Name:
As we complete each step of building my sample set, I’ll return back to the Summary area to show how our changes are reflected here.
Top Tab
Let’s start by using the Top tab to select the top three most profitable products. Here are the settings I’ll use:
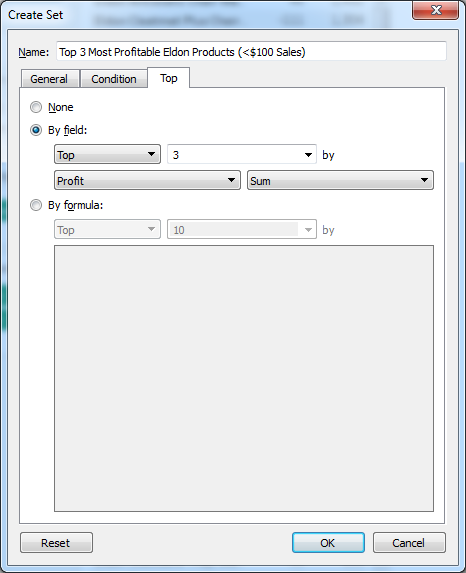
I want to use the By field option to select the top three products by the sum of profit. Remember from our parameters Deep Dive, you can insert a parameter into the number value of the Top or Bottom results. Here’s how my Summary area on the General tab has updated to reflect my selection:
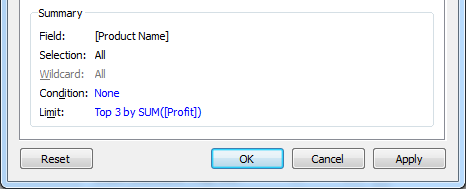
Clicking on the Top 3 by SUM([Profit]) blue text will take me back to the Top tab.
Condition Tab: Part One
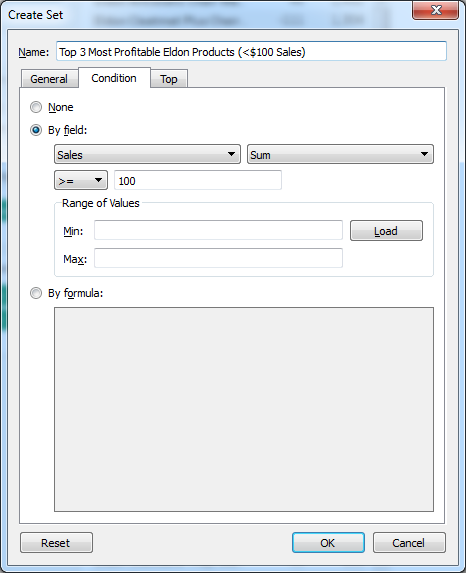
Now let’s only select products that have at least $100 or more in sales. I’ll need to use my Condition tab to do that. I’ll use the By field option with the following selections:
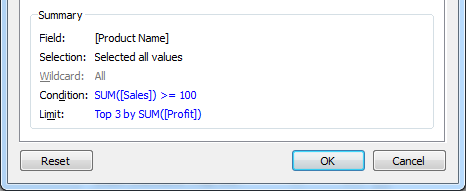
Moving back over to the General tab, I can see that my new criteria has been included in the logic that’s going to be used to build the set.
Condition Tab: Part Two
The last component of my set is to select all products from the Eldon manufacturer. In part two, I did this using the General tab with the search option to reduce my list of products to only those that had “eldon” in their title. Creating a set in this way is not dynamic. New Eldon products would not be added. So I’ll need to go back to Condition tab and use the Formula area to do this dynamically.
Deselecting my field option on this tab is going to remove my logic I created for any product that had at least $100 in sales, so I’ll have to rewrite that condition into my formula.
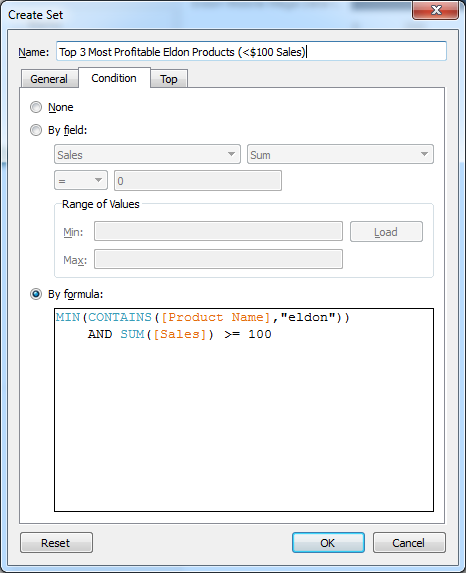
I have to use MIN because I cannot mix aggregated and non-aggregated results, since sales is aggregated by SUM. Let’s take a look at our Summary area now that all of our criteria are in place to build our computed set. Note, you might have to click OK and then edit your set to see the Condition line updated here:
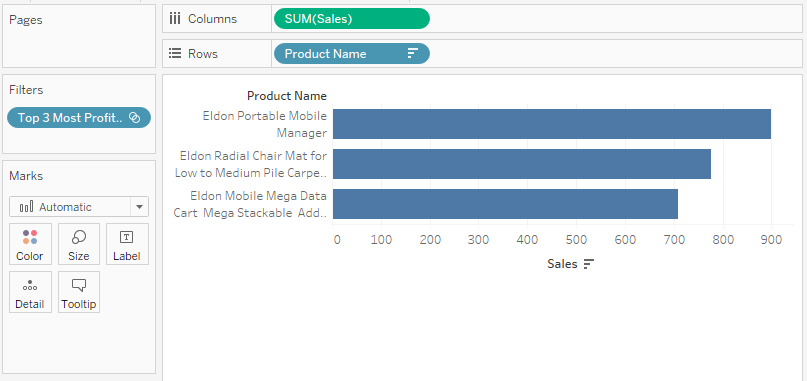
To build our view, I’ll add SUM(Sales) and Product Name to Columns and Rows respectively. Lastly, I’ll add my new set to the Filters card:
What’s Next?
Now that we have the tools to build both constant sets and computed sets, we’ll dig even deeper into how to use them on our visualizations, particularly with the IN/OUT options. Please leave any comments or questions in the area provided below. Always looking forward to your feedback. Cheers!